"BabyCenter®, LLC, the #1 pregnancy and parenting mobile and web destination worldwide, today released its 2012 American Media Mom report, the latest installment of BabyCenter's 21st Century Mom® Insights Series. At an exclusive gathering of media industry luminaries at the Time Warner Center this morning, the research detailed the dramatic reshaping of the family media ecosystem. The findings were the result of in-home interviews with moms, survey research among over 2,500 moms and other online adults, and a three-screen behavior analysis with Nielsen.
Mom uses the latest digital devices as necessities—not luxuries—to help her master the changing media landscape for herself and her family as she takes on the new role of Family Media Manager. Compared with the general population, moms over-index on ownership and usage of EVERY digital device, including laptops, digital cameras, DVRs, and gaming consoles. In particular, she is 38% more likely than the general population to own an Internet TV device (e.g. Apple TV, Roku), 28% more likely to use a tablet, and 38% more likely to own a smartphone.
[...]
While smartphones continue to be Mom's "remote control for her life," new media disruptors are taking center stage. Tablets, Internet TV, and online video are drastically reshaping the family media experience. Compared to three years ago, over one third of the general population says that they are spending less time watching live TV or reading magazines or newspapers. This pattern is even more exaggerated for Moms – they are 2/3 more likely to say that they spend less time with live TV and radio. And, moms are more than 50% more likely to say that they are spending more time with online video and internet TV than the general online population.
In the year since we unveiled BabyCenter's 21st Century Mobile Mom® Report, smartphone adoption among mothers has increased another 10 percent to 65%. According to Nielsen's Mobile Insights data from Q4 2011, Mom smartphone owners are more likely to use their devices to their fullest capacities than the general population. For instance, she is texting and using social media on her mobile device at a higher rate. Mom is also 53% more likely to use mobile banking applications and 58% more likely to shop via her mobile phone compared to the general population.
The Family Media Manager Runs the Show
[...]
Whether it's watching her favorite shows during some downtime, doling out her kids' YouTube playlist during a long car trip, or tapping into her social graph for opinions on products and services when she's in-store, she will adopt the formats that allow her to maximize her time. According to Nielsen's behavioral data, Mom's spend twice as much time online monthly: 66 hours versus 33 hours for the general population, and spends 63% more time streaming online video. We also found that Mom is 45% more likely to use social media regularly compared to the general population. In short: flexibility and efficiency rule Mom's media day.
More Devices = More Media
It is not a zero sum media game for moms. Multiple devices do not seem to be taking away time from any one media platform. On average, moms are spending 10.9 hours daily with media. According to the 2012 American Media Mom report, those who own an Internet TV device spend over 3 additional hours with media, and moms who own a smartphone, tablet AND Internet TV device are spending over 7 additional hours with media—which adds up to over 17 hours per day—in large part because of mom's heightened ability to multitask with devices and media.
Moms are media multitaskers when it comes to video. Half say that they are always or often talking to someone else or using social media while watching TV. 40% are also going online on their tablet, mobile phone or texting someone while watching TV. And 1 in 4 are talking on the phone at the same time. Moms are twice as likely to be using social media or texting while they are watching videos, 3 in 4 moms say that they skip all of the ads they can while watching television content; a rate that is 20% higher than the general online population.
Her Path to the Register Has Evolved
In BabyCenter's 2011 Shopping Rituals of the American Mom Report, we saw that the purchase funnel has been upended. In the six months since we unveiled that data, mom's reliance on mobile throughout the purchase process has dramatically increased. Usage of mobile media for getting product ideas has risen from 20% to 36%; usage of mobile product/brand recommendations has grown from 17% to 33%; using mobile for feature comparisons has risen from 21% to 37%; mobile for price comparison review grew from 28% to 45%; finding coupons or deals shifted from 22% to 31%; deciding where to buy has nearly doubled from 16% to 30%. Additionally, one in 5 moms have scanned a barcode for price comparisons in the past 30 days, and 9% regularly scan QR codes."
Source: Press release from BabyCenter, 19th April 2012
Methodology: "The findings in BabyCenter's 2012 American Media Mom report are the result of qualitative research, quantitative survey data, and three-screen behavioral data with Nielsen. We conducted in-home interviews with new and expecting moms in Chicago and San Francisco in February 2012 through our research partner Gallin Group. In addition, we conducted in-depth survey research on media behaviors and attitudes among 1100 new and expecting moms through BabyCenter's 21st Century Media Panel as well as 1400 non-moms (referred to as general population) using Socratic's online panel. Finally, Nielsen provided a three-screen behavioral analysis across Television, Online and Mobile behavior comparing BabyCenter's moms to persons 18+."
Showing posts with label time-spent. Show all posts
Showing posts with label time-spent. Show all posts
Monday, April 23, 2012

Xbox households in the US spend an average of 84 hours a month on online services
"Yusuf Mehdi, who heads up marketing and strategy for Microsoft's Xbox business, said households now spend an average of 84 hours a month on the Xbox Live online service playing games, watching videos and listening to music. That's up 30% from a year ago. Just over half that time is spent on videos and music.
By comparison, the average household spend about 150 hours a month watching television.
"What we're seeing is that people are turning on the Xbox to play games and then keeping it on afterwards to get other types of entertainment," Mehdi said."
By comparison, the average household spend about 150 hours a month watching television.
"What we're seeing is that people are turning on the Xbox to play games and then keeping it on afterwards to get other types of entertainment," Mehdi said."
Source: LA Times, 26th March 2012
Wednesday, March 21, 2012
Mobile web users spend more time with the mobile web than TV
"Mobile ad network InMobi has just published its Mobile Media Consumption Q4 2011 Survey, which questioned over 20,000 mobile consumers in 18 markets across all continents.
It found that mobile has surpassed TV in terms of time spent, with mobile web users spending 27 per cent of their media time on mobile and 22 per cent of their media time on TV
It also revealed that three quarters planning to conduct m-commerce activities within the next year (76 per cent) while 42 per cent say that mobile advertising has introduced them to something new."
It found that mobile has surpassed TV in terms of time spent, with mobile web users spending 27 per cent of their media time on mobile and 22 per cent of their media time on TV
It also revealed that three quarters planning to conduct m-commerce activities within the next year (76 per cent) while 42 per cent say that mobile advertising has introduced them to something new."
Wednesday, January 11, 2012
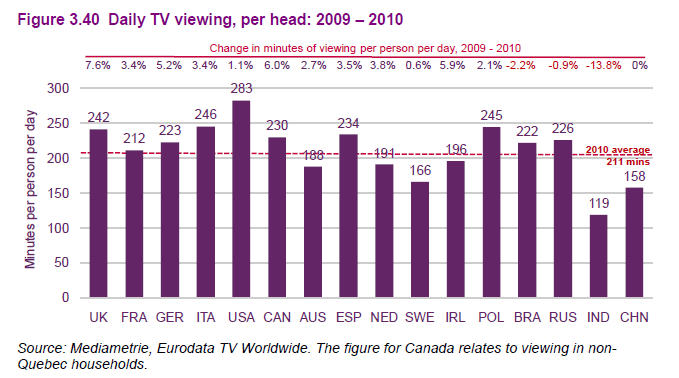
Time spent watching TV per day by Market, 2009-2010
Click to enlarge
Source: MediaMetrie, Eurodata Worldwide, in the Ofcom International Communications Market Report, December 2011
Note - The figure for Canada excludes Quebec
Lots more data and charts in the full report here
Tuesday, December 6, 2011
Chinese internet users spend more time online than with any other medium
"With out-of-home (OOH) ads and TV achieving the highest reach in Chinese consumers at 77% and 76% respectively, it is little wonder marketers are investing heavily in advertising on these two media platforms. However, the Yangtze Study reveals that the digital space ranks a close third behind OOH ads and TV in reach and is where most consumers are choosing to spend their time, with an average consumer spending 3.25 hours online, compared to 2.21 hours and 0.51 hours with TV and OOH ads, respectively. More surprisingly, the Yangtze Study also shows that consumers in tier-3 cities lead in the race when it comes to online contact hours per day, clocking in an average of 3.57 hours per day, as compared to their tier-1 and tier-2 counterparts at 3.08 hours and 3.07 hours, respectively.
The Yangtze Study also highlighted the prevalence of online entertainment, especially video, as a favorite way for Chinese consumers to digest content. Across screens, respondents spent an average of 1.76 hours daily watching video clips on computers, with tier-2 consumers heading the pack at 1.98 hours. With China home to the world‘s largest Internet population, it is highly possible that online has the potential to become the vehicle most used to access video content for cities in tiers 1-4.
"What we are witnessing now is the biggest digital evolution on earth taking place right here in China. There is a growing population of netizens in lower tiers who do not even have a TV set at home and instead are choosing to watch most of their TV content online", said Jeffrey Tan, SMG China‘s National Research & Insights Director. "While internet usage in lower tiers right now is skewed towards instant messaging and online entertainment (such as gaming, music and video), they are quickly catching on to the social networking craze that is sweeping across the country.""
The Yangtze Study also highlighted the prevalence of online entertainment, especially video, as a favorite way for Chinese consumers to digest content. Across screens, respondents spent an average of 1.76 hours daily watching video clips on computers, with tier-2 consumers heading the pack at 1.98 hours. With China home to the world‘s largest Internet population, it is highly possible that online has the potential to become the vehicle most used to access video content for cities in tiers 1-4.
"What we are witnessing now is the biggest digital evolution on earth taking place right here in China. There is a growing population of netizens in lower tiers who do not even have a TV set at home and instead are choosing to watch most of their TV content online", said Jeffrey Tan, SMG China‘s National Research & Insights Director. "While internet usage in lower tiers right now is skewed towards instant messaging and online entertainment (such as gaming, music and video), they are quickly catching on to the social networking craze that is sweeping across the country.""
Source: Research from Starcom Mediavest Group's Yangtze study, reported in a press release, 14th October 2011
Tuesday, November 15, 2011

Wednesday, November 9, 2011
A Call of Duty gamer plays for an average of 170 hours per year
"Even before the launch of Modern Warfare 3, the Call of Duty community is already one of the strongest there is. More than 30 million people have played online this year and 20 million players play each month. On average, the Call of Duty player plays 170 hours of the game per year. That’s as much time spent as watching the full series of the Sopranos and Lost, combined."
Source: Data from Activision Blizzard, reported by VentureBeat, 8th November 2011
Source: Data from Activision Blizzard, reported by VentureBeat, 8th November 2011
Thursday, October 27, 2011
Digital platforms account for nearly 30% of all UK radio listening
"Listening to radio via a digital platform in terms of weekly reach* has increased by 12% year on year,
with 22.8 million people now tuning in to radio via a digitally enabled receiver (DAB, DTV, internet) each
week (up from 20.4 million in Q3, 2010).
Digital listening hours for Q3, 2011 reached 304 million hours, up 16%, from 262 million hours in Q3,
2010. DAB radio maintains its position as the most popular device when it comes to listening to digital
radio, accounting for 63.9% of all digital hours, however listening via DTV (digital television) and internet
have both continued to rise year on year (hours up by 8% and 32% respectively), albeit from a smaller
base.
- DAB hours are 194 million (162m in Q3, 2010 – up 20%)
- DTV hours are 50 million (47m in Q3, 2010 – up 8%)
- Internet hours are 40 million (30m in Q3, 2010 – up 32%)
The share of radio listening via a digital platform now stands at 28.2% of all radio listening, increasing
from 24.8% in Q3, 2010 and up quarter on quarter by 5% (c.f. 26.9% in Q2, 2011). DAB listening
increased its share from 15.3% in Q3, 2010 to 18% in Q3, 2011, while the share of DTV listening
increased from 4.4% in Q3, 2010 to reach 4.7% this quarter; and internet listening, which currently stands
at 3.7% for Q3, 2011, is up from 2.8% in Q3, 2010"
Source: Data from Rajar, reported in a press release, 27th October 2011
with 22.8 million people now tuning in to radio via a digitally enabled receiver (DAB, DTV, internet) each
week (up from 20.4 million in Q3, 2010).
Digital listening hours for Q3, 2011 reached 304 million hours, up 16%, from 262 million hours in Q3,
2010. DAB radio maintains its position as the most popular device when it comes to listening to digital
radio, accounting for 63.9% of all digital hours, however listening via DTV (digital television) and internet
have both continued to rise year on year (hours up by 8% and 32% respectively), albeit from a smaller
base.
- DAB hours are 194 million (162m in Q3, 2010 – up 20%)
- DTV hours are 50 million (47m in Q3, 2010 – up 8%)
- Internet hours are 40 million (30m in Q3, 2010 – up 32%)
The share of radio listening via a digital platform now stands at 28.2% of all radio listening, increasing
from 24.8% in Q3, 2010 and up quarter on quarter by 5% (c.f. 26.9% in Q2, 2011). DAB listening
increased its share from 15.3% in Q3, 2010 to 18% in Q3, 2011, while the share of DTV listening
increased from 4.4% in Q3, 2010 to reach 4.7% this quarter; and internet listening, which currently stands
at 3.7% for Q3, 2011, is up from 2.8% in Q3, 2010"
Source: Data from Rajar, reported in a press release, 27th October 2011
Monday, October 24, 2011
Frequency of using tablets, smartphones & eReaders while watching TV

Click to enlarge
Source: Research by Nielsen, reported on NielsenWire, 13th October 2011
Note - US only
Friday, October 7, 2011
Tablet users in the US spend more time online than other internet users
"If early adopter metrics are a fair indication, then the tablet is poised to be a genuine game changer in both the ways in which people access the Web and the sheer volume of their use.
According to research from Knowledge Networks, tablet-owning consumers on average spend 48% more time each day with the Internet -- 4 hours and 19 minutes across platforms compared to 2 hours and 55 minutes for all users.
Knowledge Networks extracted the data from their MultiMedia Mentor database of metrics charting media usage across eight media for adults ages 18 to 64.
Owners of tablets spend just under an hour a day (55 minutes) with the Internet on these devices. The other major tablet uses -- social networking, search and gaming -- each account for about 15% or 8 minutes each of tablet time."
According to research from Knowledge Networks, tablet-owning consumers on average spend 48% more time each day with the Internet -- 4 hours and 19 minutes across platforms compared to 2 hours and 55 minutes for all users.
Knowledge Networks extracted the data from their MultiMedia Mentor database of metrics charting media usage across eight media for adults ages 18 to 64.
Owners of tablets spend just under an hour a day (55 minutes) with the Internet on these devices. The other major tablet uses -- social networking, search and gaming -- each account for about 15% or 8 minutes each of tablet time."
Source: Mediapost, 3rd October 2011
Friday, September 30, 2011

Thursday, September 22, 2011
5 of the top 10 markets where most time is spent on social networking sites are in Latin America
"Latin Americans are strongly engaged with social networking. Half of the top 10 worldwide markets ranked by time spent on social networking sites are in Latin America, with Argentina leading the region at 10 hours per month in June 2011.
The Latin American social networking audience is nearly equal in its composition of males and females, but females account for a larger share of social networking time spent (53.6 percent) compared to males (46.4 percent). This trend was most significant in Brazil where females accounted for 58.7 percent of all social networking time spent.
People age 15-24 demonstrated the strongest engagement on social networks, accounting for nearly half (48.0 percent) of all time spent in the category. This trend was most significant in Venezuela where visitors age 15-24 accounted for 3 of every 5 social networking minutes (58.2 percent).
Facebook.com strongly led the social networking market in Latin America, reaching more than 91 million visitors. Windows Live Profile ranked #2 with more than 35.5 million visitors in the region. Orkut held the #3 spot with 34.4 million visitors, largely driven by the site’s popularity in Brazil, while Twitter.com ranked #4 with 24.3 million visitors.
Five of the top 10 markets ranked by Facebook.com reach are in Latin America. Facebook reached 90.9 percent of all online users in Chile, ranking as the most penetrated market in Latin America.
In Brazil, Orkut ranked as the most-visited social networking destination, reaching 35.7 million visitors, an increase of 20 percent from June 2010. Facebook.com, which is the second largest social networking site in Brazil, witnessed strong growth increasing 192 percent to 24.5 million visitors.
Venezuela is the only country in Latin America in which Twitter.com rises to second place in the social networking ranking. One in four online users in Venezuela visited Twitter.com in June (26.5 percent reach).
Recently launched Google+ reached 28 million visitors worldwide in the first 33 days of its public existence (June 29, 2011 to July 31, 2011). Brazil ranked as the sixth largest market for the site globally, contributing 793,923 visitors."
Source: Press release from comScore, 20th September 2011
The Latin American social networking audience is nearly equal in its composition of males and females, but females account for a larger share of social networking time spent (53.6 percent) compared to males (46.4 percent). This trend was most significant in Brazil where females accounted for 58.7 percent of all social networking time spent.
People age 15-24 demonstrated the strongest engagement on social networks, accounting for nearly half (48.0 percent) of all time spent in the category. This trend was most significant in Venezuela where visitors age 15-24 accounted for 3 of every 5 social networking minutes (58.2 percent).
Facebook.com strongly led the social networking market in Latin America, reaching more than 91 million visitors. Windows Live Profile ranked #2 with more than 35.5 million visitors in the region. Orkut held the #3 spot with 34.4 million visitors, largely driven by the site’s popularity in Brazil, while Twitter.com ranked #4 with 24.3 million visitors.
Five of the top 10 markets ranked by Facebook.com reach are in Latin America. Facebook reached 90.9 percent of all online users in Chile, ranking as the most penetrated market in Latin America.
In Brazil, Orkut ranked as the most-visited social networking destination, reaching 35.7 million visitors, an increase of 20 percent from June 2010. Facebook.com, which is the second largest social networking site in Brazil, witnessed strong growth increasing 192 percent to 24.5 million visitors.
Venezuela is the only country in Latin America in which Twitter.com rises to second place in the social networking ranking. One in four online users in Venezuela visited Twitter.com in June (26.5 percent reach).
Recently launched Google+ reached 28 million visitors worldwide in the first 33 days of its public existence (June 29, 2011 to July 31, 2011). Brazil ranked as the sixth largest market for the site globally, contributing 793,923 visitors."
Source: Press release from comScore, 20th September 2011
Monday, September 19, 2011
Social networks and blogs account for nearly a quarter of the time Americans spend online
"Highlights of Nielsen’s “State of the Media: The Social Media Report”
Social networks and blogs continue to dominate Americans’ time online, now accounting for nearly a quarter of total time spent on the Internet
At over 53 billion total minutes during May 2011, Americans spend more time on Facebook than they do on any other website
Tumblr is an emerging player in social media, nearly tripling its audience from a year ago
Nearly 40 percent of social media users access social media content from their mobile phone
Internet users over the age of 55 are driving the growth of social networking through the Mobile Internet
70 percent of active online adult social networkers shop online, 12 percent more likely than the average adult Internet user
Across a sample of 10 global markets, social networks and blogs are the top online destination in each country, accounting for the majority of time spent online and reaching at least 60 percent of active Internet users"
Source: Data from Nielsen's 'State of the Media: The Social Media Report', quoted on NielsenWire, 11th Septeber 2011
See the full report here
Social networks and blogs continue to dominate Americans’ time online, now accounting for nearly a quarter of total time spent on the Internet
At over 53 billion total minutes during May 2011, Americans spend more time on Facebook than they do on any other website
Tumblr is an emerging player in social media, nearly tripling its audience from a year ago
Nearly 40 percent of social media users access social media content from their mobile phone
Internet users over the age of 55 are driving the growth of social networking through the Mobile Internet
70 percent of active online adult social networkers shop online, 12 percent more likely than the average adult Internet user
Across a sample of 10 global markets, social networks and blogs are the top online destination in each country, accounting for the majority of time spent online and reaching at least 60 percent of active Internet users"
Source: Data from Nielsen's 'State of the Media: The Social Media Report', quoted on NielsenWire, 11th Septeber 2011
See the full report here
Thursday, August 18, 2011
American Android users spend nearly an hour a day interacting with apps and the web through their device

Click to enlarge
Source: Data from Nielsen, reported in their NielsenWire, 18th August 2011
Note - as ever with Nielsen there's more data in the article
Monday, August 15, 2011
British TV viewing rose to its highest ever level in H1 2011
"The average amount of television watched by UK viewers each day hit a new high in the first half of 2011, driven by factors including people watching more live TV to avoid online spoilers.
Viewers are also watching more non-live TV on personal video recorders such as Sky+.
UK viewers notched up an average of four hours and three minutes a day of TV watching in the six months to the end of June, an increase of 51 seconds a day year-on-year, according to a report published on Monday by TV marketing body Thinkbox.
Viewers were exposed to an average of 47 ads a day – up from 45 in the same period last year.
Thinkbox, which uses figures from TV audience measurement organisation Barb, said that a number of factors had fuelled the rise in overall viewing."
Source: Analysis from Thinkbox, taken from BARB data, reported by The Guardian, 15th August 2011
Viewers are also watching more non-live TV on personal video recorders such as Sky+.
UK viewers notched up an average of four hours and three minutes a day of TV watching in the six months to the end of June, an increase of 51 seconds a day year-on-year, according to a report published on Monday by TV marketing body Thinkbox.
Viewers were exposed to an average of 47 ads a day – up from 45 in the same period last year.
Thinkbox, which uses figures from TV audience measurement organisation Barb, said that a number of factors had fuelled the rise in overall viewing."
Source: Analysis from Thinkbox, taken from BARB data, reported by The Guardian, 15th August 2011
Friday, August 12, 2011
35% of American iPad or tablet use happens in front of the TV
"Companion device usage while watching TV is big, too. 35% of tablet and iPad usage occurs in front of the television, and this is before we really have that many robust and specialized applications to truly enhance or support better TV viewing experiences. Many (including me) predict that app-enabled iPhones, tablets and iPads will be the dominant "remote controls" for home television in a few years."
Source: Data from the Social TV Summit in LA, reported by MediaPost, 21st July 2011
Thursday, August 4, 2011
Key Ofcom stats for the UK
"Internet
Number of fixed residential broadband connections in the UK - 18.0 million (end 2010).
Proportion of adults with broadband in the UK (fixed + mobile) - 74% (Q1 2011)
Proportion of adults with mobile broadband in the UK - 17% (Q1 2011)
Proportion of adults with a social networking profile - 48% (Q1 2011)
Proportion of people who use their mobile to access the internet - 32% (Q1 2011)
Number of mobile broadband (Dongles/PC datacard) subscriptions - 4.8 million (end 2010)
Landline/mobile phones
Number of residential fixed landlines in the UK - 23.7 million (end 2010)
Number of fixed landlines in the UK, including ISDN channels - 33.4 million (end 2010)
Proportion of adults who personally own/use a mobile phone in the UK - 91% (Q1 2011)
Proportion of adults who live in a home that has a mobile phone but no landline phone in the UK - 15% (Q1 2011)
How many PAYG mobile subscriptions in the UK ? - 51% (Q1 2011)
Number of text messages sent per mobile subscription per month - 133 (in 2010)
Number of 3G mobile subscriptions in the UK - 33.1 million (end 2010)
Digital television
Proportion of UK homes with digital TV 93% (Q1 2011)
Number of TVs in the UK 60m (end 2010)
Number of HD TVs in the UK - 24m (Q1 2010)
Number of minutes of TV people aged 4+ watch each day - 242 (average in 2010)
Number of UK homes with Freeview on any set - 74% (Q1 2011)
Proportion of UK homes with Freeview on their main set - 38% (Q1 2011)
Digital radio
Proportion of households with access to a DAB Digital Radio - 37% (Q1 2011)
Proportion of listener hours through a digital platform (DAB, online, DTV) - 26.5% (Q1 2011)
Number of digital radio stations - 216 (end 2009)
Number of local radio stations (excluding community stations) - 344 (July2011)
Number of national radio stations - 21 (July 2011)"
Source: Ofcom's latest facts and figures on the UK, retrieved 4th August 2011
Number of fixed residential broadband connections in the UK - 18.0 million (end 2010).
Proportion of adults with broadband in the UK (fixed + mobile) - 74% (Q1 2011)
Proportion of adults with mobile broadband in the UK - 17% (Q1 2011)
Proportion of adults with a social networking profile - 48% (Q1 2011)
Proportion of people who use their mobile to access the internet - 32% (Q1 2011)
Number of mobile broadband (Dongles/PC datacard) subscriptions - 4.8 million (end 2010)
Landline/mobile phones
Number of residential fixed landlines in the UK - 23.7 million (end 2010)
Number of fixed landlines in the UK, including ISDN channels - 33.4 million (end 2010)
Proportion of adults who personally own/use a mobile phone in the UK - 91% (Q1 2011)
Proportion of adults who live in a home that has a mobile phone but no landline phone in the UK - 15% (Q1 2011)
How many PAYG mobile subscriptions in the UK ? - 51% (Q1 2011)
Number of text messages sent per mobile subscription per month - 133 (in 2010)
Number of 3G mobile subscriptions in the UK - 33.1 million (end 2010)
Digital television
Proportion of UK homes with digital TV 93% (Q1 2011)
Number of TVs in the UK 60m (end 2010)
Number of HD TVs in the UK - 24m (Q1 2010)
Number of minutes of TV people aged 4+ watch each day - 242 (average in 2010)
Number of UK homes with Freeview on any set - 74% (Q1 2011)
Proportion of UK homes with Freeview on their main set - 38% (Q1 2011)
Digital radio
Proportion of households with access to a DAB Digital Radio - 37% (Q1 2011)
Proportion of listener hours through a digital platform (DAB, online, DTV) - 26.5% (Q1 2011)
Number of digital radio stations - 216 (end 2009)
Number of local radio stations (excluding community stations) - 344 (July2011)
Number of national radio stations - 21 (July 2011)"
Source: Ofcom's latest facts and figures on the UK, retrieved 4th August 2011
Wednesday, July 6, 2011

Friday, June 24, 2011
The average smartphone user spends 9% more time using mobile apps than the internet

Click to enlarge
"Our analysis shows that, for the first time ever, daily time spent in mobile apps surpasses desktop and mobile web consumption. This stat is even more remarkable if you consider that it took less than three years for native mobile apps to achieve this level of usage, driven primarily by the popularity of iOS and Android platforms. Let’s take a look at the numbers.
[...]
Flurry found that the average user now spends 9% more time using mobile apps than the Internet. This was not the case just 12 months ago. Last year, the average user spent just under 43 minutes a day using mobile applications versus an average 64 minutes using the Internet. Growing at 91% over the last year, users now spend over 81 minutes on mobile applications per day. This growth has come primarily from more sessions per user, per day rather than a large growth in average session lengths. Time spent on the Internet has grown at a much slower rate, 16% over the last year, with users now spending 74 minutes on the Internet a day."
Source: Blog post from Flurry, 20th June 2011
Note on methodology:
"In this report, Flurry compares how daily interactive consumption has changed over the last 12 months between the web (both desktop and mobile web) and mobile native apps. For Internet consumption, we built a model using publicly available data from comScore and Alexa. For mobile application usage, we used Flurry Analytics data, now exceeding 500 million aggregated, anonymous use sessions per day across more than 85,000 applications. We estimate this accounts for approximately one third of all mobile application activity, which we scaled-up accordingly for this analysis.
[...]
The preceding chart compares the average number of minutes consumers spend per day in mobile native apps vs. the web. For mobile apps, Flurry tracks iOS, Android, BlackBerry, Windows Phone and J2ME. And for the web, our figures include the open web, Facebook and the mobile web. "
Subscribe to:
Posts (Atom)