Showing posts with label Canada. Show all posts

Wednesday, January 11, 2012

Time spent watching TV per day by Market, 2009-2010


Click to enlarge

Source:  MediaMetrie, Eurodata Worldwide, in the Ofcom International Communications Market Report, December 2011
Note - The figure for Canada excludes Quebec
Lots more data and charts in the full report here

Thursday, December 1, 2011

40% of mobile users in Canada have a smartphone

"8 million people in Canada owned smartphones in September 2011, representing 40 percent of the mobile market in Canada, a gain of 7 percentage points in the past six months. RIM ranked as the top platform with 35.8 percent of the smartphone market, followed by Apple at 30.1 percent. Google Android gained ground among the competition by doubling its market share to 25.0 over the past six months. Symbian ranked fourth with 4.2 percent share, followed by Microsoft with 3.2 percent."
Source:  Data from comScore, reported in a press release, 30th November 2011

Friday, November 4, 2011

2/3 of college students would rather have an internet connection than a car


Click to enlarge

Source:  Taken from Cisco's World Technology Report, September 2011
Press release here
Methodology - 1,400 college students aged 18-23 & 1400 young professionals under 30.
The survey was translated into local languages and fielded in 14 countries to gain approximately
100 completes for each subgroup in each country
Countries: United States, Canada, Mexico, Brazil, United Kingdom, France, Spain, Germany, Italy,
Russia, India, China, Japan, Australia

Friday, July 8, 2011

The top 10 markets for mobile barcode use in May 2011

"Top 10 users of mobile barcodes during May/2011
(1) 1. United States
(2) 2. Germany
(4) 3. United Kingdom
(3) 4. Italy
(5) 5. Canada
(6) 6. Netherlands
(7) 7. France
(8) 8. Hong Kong
(9) 9. Spain
(13) 10. Australia
() – Position in April/2011

Top 5 growing countries for May/2011
1. Australia - (74.1% Growth over April/2011)
2. Hong Kong - (43.3%)
3. United States - (39.0%)
4. France - (32.2%)
5. United Kingdom - (31.5%)"
Source:  Data from 3GVision, reported in a press release, 7th June 2011

Note - these reports do not include Japan
"Notes on reporting methodology:
-  These reports are based on the total number of QRcode, Datamatrix and UPC/EAN scans recorded by the i-nigma system during the relevant periods. Because of i‑nigma’s prominence in many markets worldwide, we believe that these numbers are likely to be indicative of global mobile barcode activity
-  The reports do not include activity in Japan, which is known to be well ahead in popularity and usage of mobile barcodes
-  For better representation of global open market trends, the reports specifically exclude the activity of i‑nigma-based solutions that are used by our vertical customers
-  Top 5 growing countries are from the top 20 countries in mobile barcodes usage during May/2011"

Wednesday, July 28, 2010

Bloggers, by country


Click to enlarge
"It should not be much of a surprise that the most bloggers (29.2%) are located in the U.S. In fact, there are more than four times as many bloggers in the U.S. as there are in the second most populated country within the blogosphere - the U.K., which is home to 6.75% of bloggers.
Japan accounts for the third-most bloggers (4.9%), followed by Brazil (4.2%), Canada (3.9%), Germany (3.3%), Italy (3.2%), Spain (3.1%), France (2.9%) and Russia (2.3%)."
Source:  Inside Blog Demographics, Sysomos, June 2010

Monday, April 19, 2010

Twitter users by Country & City, January 2010

The US is the most active country, and London is the most active city:


Source: Exploring the Use of Twitter Around the World, Sysomos, January 2010

Thursday, December 17, 2009

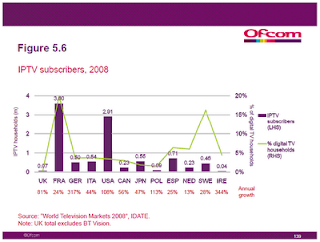
Comparative Figures - IPTV Subscribers & penetrations around the world, 2008


Click to enlarge

IPTV is most popular in France, and least popular in the UK and Ireland. UK figures exclude BT Vision
Source: IDATE, as reported by in Figure 5.6 of Ofcom International Communications Market 2009, December 2009
Read more about this report at the Ofcom website

Comparative Figures - Mobile as a proportion of total mobile and fixed line revenues, and mobile and fixed line connections, 2003 & 2008

Click to enlarge

In Poland 75% of mobile and fixed telephone revenue is generated by mobile, and 81% of connections are mobile

Source: IDATE/ Industry Data / Ofcom, reported in charts 4.7 & 4.10 of Ofcom International Communications Market 2009, December 2009
Read more about this report at the Ofcom website

Comparative Figures - Ad Spend by Media around the world 2008

Click to enlarge

Of the markets examined, the UK has the highest percentage level of internet ad spend
Source: World Advertising Trends data, quoted in figure 2.12, Ofcom International Communications Market 2009, December 2009
Read more about this report at the Ofcom website