the smell of data in the morning! Interesting and surprising statistics about digital media and devices. Compiled & curated by Dan Calladine, Aegis Media - dan.calladine@aemedia.com - All views expressed are my own. Please email me if you have any queries, amendments or suggestions
Showing posts with label Netherlands. Show all posts
Wednesday, January 4, 2012
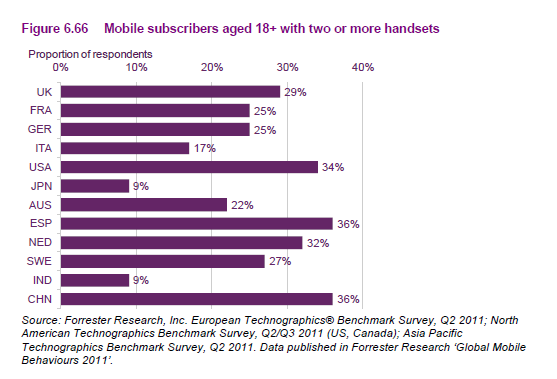
The percentage of mobile subscribers with 2 or more handsets, by market
Click to enlarge
Source: Forrester Research Q2/Q3 2011, in the Ofcom International Communications Market Report, December 2011
Lots more data and charts in the full report here
Tuesday, November 15, 2011
Internet users & usage in Europe, September 2011
Labels:
access stats,
Austria,
Denmark,
Europe,
Finland,
France,
Netherlands,
Norway,
Russia,
Spain,
Sweden,
Switzerland,
time-spent,
UK
Tuesday, August 16, 2011
Thursday, May 5, 2011
Internet users & time spent by market in Europe, March 2011
Labels:
access stats,
Austria,
Denmark,
Europe,
Finland,
France,
Germany,
Italy,
Netherlands,
Norway,
Russia,
Spain,
Sweden,
Switzerland,
UK
Thursday, April 28, 2011
TV viewing is rising in Europe
"Consumers in some of Europe's biggest markets are spending more time watching television, a new study has shown.
Research firm Eurodata suggested people in the UK dedicated 3 hours 57 minutes to TV every day during the opening eight months of 2010, a 15 minute increase on an annual basis.
The Netherlands generated a seven minute uptick from exactly three hours registered between January and August 2009.
Similarly, the average member of the Spanish audience commits 3 hours 49 minutes to this medium, a six minute improvement."
Research firm Eurodata suggested people in the UK dedicated 3 hours 57 minutes to TV every day during the opening eight months of 2010, a 15 minute increase on an annual basis.
The Netherlands generated a seven minute uptick from exactly three hours registered between January and August 2009.
Similarly, the average member of the Spanish audience commits 3 hours 49 minutes to this medium, a six minute improvement."
Source: Data from Eurodata, reported by Warc, 30th September 2010
Monday, March 14, 2011
Wednesday, March 9, 2011
Mobile ad spend by market, 2005-2009
Click to enlarge
Source: Page 219 of Ofcom's International Communications Market Report, December 2010
Thursday, December 17, 2009
Comparative Figures - IPTV Subscribers & penetrations around the world, 2008

Click to enlarge
IPTV is most popular in France, and least popular in the UK and Ireland. UK figures exclude BT Vision
Source: IDATE, as reported by in Figure 5.6 of Ofcom International Communications Market 2009, December 2009
Read more about this report at the Ofcom website
Comparative Figures - Mobile as a proportion of total mobile and fixed line revenues, and mobile and fixed line connections, 2003 & 2008
In Poland 75% of mobile and fixed telephone revenue is generated by mobile, and 81% of connections are mobile
Source: IDATE/ Industry Data / Ofcom, reported in charts 4.7 & 4.10 of Ofcom International Communications Market 2009, December 2009
Read more about this report at the Ofcom website
Comparative Figures - Ad Spend by Media around the world 2008
Of the markets examined, the UK has the highest percentage level of internet ad spend
Source: World Advertising Trends data, quoted in figure 2.12, Ofcom International Communications Market 2009, December 2009
Read more about this report at the Ofcom website
Wednesday, October 7, 2009
The UK exports more TV formats than any other country
"Formats like “Deal or No Deal”, “Hole in the Wall” and “Lalola” travel around the world inspiring millions of people. 445 original formats found their way to foreign countries from 2006 to 2008. The number nearly doubled from the first report made on behalf of FRAPA, which analysed the formats traded from 2002 to 2004.
The production volume generated by traded formats has grown to €9.3 billion for the years 2006 to 2008. This is an enormous increase of 45 % in comparison to the first report. The UK still leads in the number of exported formats, followed by the USA, The Netherlands and Argentina."
Source: Press release for The Format Recognition and Protection Association (FRAPA), 6th October 2009
The production volume generated by traded formats has grown to €9.3 billion for the years 2006 to 2008. This is an enormous increase of 45 % in comparison to the first report. The UK still leads in the number of exported formats, followed by the USA, The Netherlands and Argentina."
Source: Press release for The Format Recognition and Protection Association (FRAPA), 6th October 2009
Wednesday, March 25, 2009
Facebook is now the largest social network in 9 of the top 12 European countries
comScore data for February 2009 shows that Facebook is the largest social network in 9 of the top 12 European markets as measured by unique visitors - UK, France, Spain, Italy, Belgium, Sweden, Norway, Denmark & Finland. In Austria Netlog is larger (but Facebook is only 25,000 visitors behind), in Germany StudiVz (including SchuelerVz) is larger, and in the Netherlands Hyves is lager. Facebook is 2nd in all of these markets apart from Germany, where it is fourth behind StudiVz sites, wer-kennt-wen, and MySpace.
Source: comScore MediaMetrix February 2009 data, analysed by Isobar
Labels:
Austria,
Denmark,
Europe,
Finland,
France,
Germany,
Italy,
Netherlands,
Norway,
site stats,
social networks,
Spain,
Sweden,
UK
Saturday, November 29, 2008
Online advertising accounts for more than 10% of all ad spend in 7 European markets
"Online advertising accounted for at least 10 percent of overall advertising spending in Denmark, Germany, the Netherlands, Norway, Poland, Sweden and the UK, the report said.
Norwegian Internet users were the most expensive to target, with advertisers spending 133.20 euros per consumer reached, compared with the European average of 80.60 euros. In the United States, the average was 91.90 euros per person.
The sectors investing most in online advertising were entertainment and leisure, telecoms, and finance and insurance."
Source: Reuters, 2nd June 2008, citing data from the IAB/PWC
Norwegian Internet users were the most expensive to target, with advertisers spending 133.20 euros per consumer reached, compared with the European average of 80.60 euros. In the United States, the average was 91.90 euros per person.
The sectors investing most in online advertising were entertainment and leisure, telecoms, and finance and insurance."
Source: Reuters, 2nd June 2008, citing data from the IAB/PWC
Labels:
advertising,
Denmark,
Europe,
Germany,
Netherlands,
Norway,
Poland,
Sweden,
UK
Subscribe to:
Posts (Atom)


