"According to Socialbakers, the countries with the highest Facebook mobile penetration are:
Nigeria: 81.2 percent
Brunei: 80.8 percent
South Africa: 80.5 percent
Malawi: 78.3 percent
Papua New Guinea: 78.3 percent
Namibia: 76.7 percent
Botswana: 76.4 percent
Zambia: 73.9 percent
Japan: 72.1 percent
Singapore: 71.8 percent"
Source: AllFacebook, 8th May 2012
Note - this means the number who access via mobile as a percent of the total users - but the people accessing via mobile may also access on a desktop device.
Showing posts with label Africa. Show all posts
Showing posts with label Africa. Show all posts
Wednesday, May 9, 2012

Monday, April 30, 2012
School attendance among 5- to 24-year-olds in Liberia
An article that was published on this site in July 2011, "School attendance by grade and age in Liberia", shows that overage school attendance is very common in Liberia, mainly due to late entry into the education system. The official primary school age in Liberia is 6 to 11 years according to the International Standard Classification of Education (ISCED). Yet, an analysis of data from a Demographic and Health Survey (DHS) from 2007 demonstrates that the vast majority of pupils in primary and secondary school in Liberia are older than the theoretical age for their grade. For example, nearly three quarters of all first-graders in Liberia are at least 3 years older than the official entrance age into primary education (see Figure 1). 24% of all first-graders are 5 or 6 years overage, 14% are 7 or 8 years overage, and 5% are 9 or more years overage. Children in the last group start primary school at age 15 or later.
Figure 1: Age distribution of pupils in primary and secondary education in Liberia, 2007

Source: Demographic and Health Survey (DHS) 2007. - Click image to enlarge.
Figure 1 shows the age distribution in the 12 grades of primary and secondary education in Liberia. The same DHS data from 2007 can also be analyzed differently, by single year of age instead of by grade. Figure 2 presents the level and grade attended for the population between 5 and 24 years of age. For each age group, the graph shows the percentage in pre-primary, primary, secondary, and tertiary education. The data for primary and secondary education is further divided into single grades, indicated by shades of blue for the 6 primary grades and shades of green for the 6 secondary grades. In addition, Figure 2 shows how many percent are out of school and for how many percent the level and grade of education attended is missing.
Figure 2: Level and grade of education attended by population 5-24 years in Liberia, 2007

Source: Demographic and Health Survey (DHS) 2007. - Click image to enlarge.
One surprising finding is the large percentage of children between 5 and 14 years who are in pre-primary education. About half of all 5- to 8-year-olds, 39% of all 9-year-olds, and 28% of all 10-year-olds are in pre-primary education. Even at age 14, nearly 7% are still in preschool. One possible explanation is that parents keep their children in pre-primary education due to lack of access to primary education.
Some children start attending primary education at age 5 or 6 but most children enter late. Even among persons 20 years or older, some are still in the first primary grade. School attendance overall reaches a peak at age 14, when more than 86% are in school, mostly in primary education. Primary school attendance rates are highest among 12- to 15-year-olds; two out of three children in this age group are in primary education. Secondary school attendance reaches a peak at age 19, when 38% are in secondary education; in addition, at least 30% of all 17- and 18-year-olds are in secondary education. Attendance rates for tertiary education are low and do not exceed 2% until age 24, when 4% study at a university or other institution of higher learning.
The percentage of the population that is not in any type of formal education decreases from 44% among 5-year-olds to 13% among 14-year-olds. From age 15, out-of-school rates increase again and among 23- and 24-year-olds in Liberia, 61% and 60%, respectively, are not in school. Lastly, for a small percentage of the DHS sample, the grade and level attended was missing.
Related articles
Friedrich Huebler, 30 April 2012, Creative Commons License
Permanent URL: http://huebler.blogspot.com/2012/04/liberia.html
Figure 1: Age distribution of pupils in primary and secondary education in Liberia, 2007

Source: Demographic and Health Survey (DHS) 2007. - Click image to enlarge.
Figure 1 shows the age distribution in the 12 grades of primary and secondary education in Liberia. The same DHS data from 2007 can also be analyzed differently, by single year of age instead of by grade. Figure 2 presents the level and grade attended for the population between 5 and 24 years of age. For each age group, the graph shows the percentage in pre-primary, primary, secondary, and tertiary education. The data for primary and secondary education is further divided into single grades, indicated by shades of blue for the 6 primary grades and shades of green for the 6 secondary grades. In addition, Figure 2 shows how many percent are out of school and for how many percent the level and grade of education attended is missing.
Figure 2: Level and grade of education attended by population 5-24 years in Liberia, 2007

Source: Demographic and Health Survey (DHS) 2007. - Click image to enlarge.
One surprising finding is the large percentage of children between 5 and 14 years who are in pre-primary education. About half of all 5- to 8-year-olds, 39% of all 9-year-olds, and 28% of all 10-year-olds are in pre-primary education. Even at age 14, nearly 7% are still in preschool. One possible explanation is that parents keep their children in pre-primary education due to lack of access to primary education.
Some children start attending primary education at age 5 or 6 but most children enter late. Even among persons 20 years or older, some are still in the first primary grade. School attendance overall reaches a peak at age 14, when more than 86% are in school, mostly in primary education. Primary school attendance rates are highest among 12- to 15-year-olds; two out of three children in this age group are in primary education. Secondary school attendance reaches a peak at age 19, when 38% are in secondary education; in addition, at least 30% of all 17- and 18-year-olds are in secondary education. Attendance rates for tertiary education are low and do not exceed 2% until age 24, when 4% study at a university or other institution of higher learning.
The percentage of the population that is not in any type of formal education decreases from 44% among 5-year-olds to 13% among 14-year-olds. From age 15, out-of-school rates increase again and among 23- and 24-year-olds in Liberia, 61% and 60%, respectively, are not in school. Lastly, for a small percentage of the DHS sample, the grade and level attended was missing.
Related articles
- School attendance by grade and age in Liberia
- Overage pupils in primary and secondary education
- Official school ages: primary, secondary, and compulsory education
- Primary school entrance age and duration
- Survival rate to the last grade of primary school
- Transition from primary to secondary education
- Regional disparities in school life expectancy
- Educational attainment in sub-Saharan Africa
- Children of primary and secondary school age out of school
- Children out of school: Global trend 1999-2008
- Review of the International Standard Classification of Education (ISCED)
Friedrich Huebler, 30 April 2012, Creative Commons License
Permanent URL: http://huebler.blogspot.com/2012/04/liberia.html
Sunday, February 26, 2012
Educational attainment in sub-Saharan Africa
The educational attainment of a country's adult population reflects long-run trends in participation in primary, secondary and post-secondary education. Educational attainment is a measure of human capital - the skills and competencies of the population - and thus an indicator of a country's potential for economic growth. Educational attainment is also closely linked to health, political participation, and other indicators of social development.
Compared to other regions, educational attainment in sub-Saharan Africa is relatively low but there are large variations between individual countries. The graph and table below present data from the UNESCO Institute for Statistics (UIS), published in the Global Education Digest 2011. The values for each country indicate which percentage of the population aged 25 years and older completed at least primary, lower secondary, upper secondary, post-secondary, or tertiary education. For example, in Seychelles, 90% of the adult population completed at least primary education, 67% at least lower secondary education, and 44% at least upper secondary education. At the other end of the distribution is Burkina Faso, where only 5% of the adult population completed at least primary education and only 2% at least lower secondary education.
Sub-Saharan Africa: Population 25 years and older by minimum level of education

Source: UNESCO Institute for Statistics, Global Education Digest 2011, Table 19. - Click image to enlarge.
Among the 15 countries in sub-Saharan Africa for which UIS has data, only seven - Kenya, Mauritius, Namibia, Seychelles, South Africa, Tanzania, and Zimbabwe - have attainment rates for primary education at or above 50%. In the remaining eight countries with data - Benin, Burkina Faso, Chad, Lesotho, Malawi, Mali, Senegal, and Uganda - less than half of the population 25 years and older completed at least primary education. For Benin, the share of the population with completed primary education is unknown because the country reported combined figures for incomplete and complete primary education; 16% of the population attended primary education with or without completing that level (see Global Education Digest 2011, Table 18).
Similar to the attainment rates for primary education, attainment rates for other levels of education also vary widely between individual countries. The proportion of the population that completed at least lower secondary education ranges from 2% in Burkina Faso to 70% in South Africa. For upper secondary education, the attainment rates range from 0.5% in Burkina Faso to 44% in Seychelles. Not more than 0.5% of the adult population completed post-secondary education in Burkina Faso and Malawi, compared to 12% in South Africa. Completed tertiary education is uncommon among the population 25 years and older in sub-Saharan Africa. Only one country, Seychelles, has an attainment rate for tertiary education greater than 3%.
Sub-Saharan Africa: Population 25 years and older by minimum level of education
Source: UNESCO Institute for Statistics, Global Education Digest 2011, Table 19.
When interpreting the educational attainment data for sub-Saharan Africa it is necessary to consider that the reported values for some countries are more than a decade old. As younger, more educated cohorts reach age 25, the average attainment rates of the population 25 years and older increase and the situation of some countries is therefore likely to have improved since the year of reporting. In addition, the picture is incomplete because for 30 of the 45 countries in the sub-Saharan Africa region, as defined by UIS, no educational attainment data is available in the UIS Data Centre.
Reference
Related articles
Permanent URL: http://huebler.blogspot.com/2012/02/ssa.html
Compared to other regions, educational attainment in sub-Saharan Africa is relatively low but there are large variations between individual countries. The graph and table below present data from the UNESCO Institute for Statistics (UIS), published in the Global Education Digest 2011. The values for each country indicate which percentage of the population aged 25 years and older completed at least primary, lower secondary, upper secondary, post-secondary, or tertiary education. For example, in Seychelles, 90% of the adult population completed at least primary education, 67% at least lower secondary education, and 44% at least upper secondary education. At the other end of the distribution is Burkina Faso, where only 5% of the adult population completed at least primary education and only 2% at least lower secondary education.
Sub-Saharan Africa: Population 25 years and older by minimum level of education

Source: UNESCO Institute for Statistics, Global Education Digest 2011, Table 19. - Click image to enlarge.
Among the 15 countries in sub-Saharan Africa for which UIS has data, only seven - Kenya, Mauritius, Namibia, Seychelles, South Africa, Tanzania, and Zimbabwe - have attainment rates for primary education at or above 50%. In the remaining eight countries with data - Benin, Burkina Faso, Chad, Lesotho, Malawi, Mali, Senegal, and Uganda - less than half of the population 25 years and older completed at least primary education. For Benin, the share of the population with completed primary education is unknown because the country reported combined figures for incomplete and complete primary education; 16% of the population attended primary education with or without completing that level (see Global Education Digest 2011, Table 18).
Similar to the attainment rates for primary education, attainment rates for other levels of education also vary widely between individual countries. The proportion of the population that completed at least lower secondary education ranges from 2% in Burkina Faso to 70% in South Africa. For upper secondary education, the attainment rates range from 0.5% in Burkina Faso to 44% in Seychelles. Not more than 0.5% of the adult population completed post-secondary education in Burkina Faso and Malawi, compared to 12% in South Africa. Completed tertiary education is uncommon among the population 25 years and older in sub-Saharan Africa. Only one country, Seychelles, has an attainment rate for tertiary education greater than 3%.
Sub-Saharan Africa: Population 25 years and older by minimum level of education
| Country | Year | Level of education (%) | ||||
| Primary | Lower secondary | Upper secondary | Post- secondary | Tertiary | ||
| Benin | 2002 | . | 14.3 | . | 2.2 | 2.2 |
| Burkina Faso | 2007 | 5.2 | 2.0 | 0.5 | 0.3 | 0.2 |
| Chad | 2004 | 8.5 | 5.5 | . | 3.2 | 3.2 |
| Kenya | 2010 | 59.4 | 41.9 | 36.3 | 6.3 | 0.0 |
| Lesotho | 2008 | 40.9 | 20.9 | 13.8 | 5.4 | 1.9 |
| Malawi | 1998 | 19.8 | 8.6 | 5.2 | 0.5 | 0.5 |
| Mali | 2006 | 18.6 | 10.3 | 5.5 | 1.9 | 1.9 |
| Mauritius | 2000 | 48.9 | 38.9 | 20.3 | 7.9 | 2.6 |
| Namibia | 2001 | 48.5 | 27.7 | 17.0 | 5.3 | 2.2 |
| Senegal | 2006 | 10.7 | 7.5 | 4.9 | 3.2 | 0.8 |
| Seychelles | 2002 | 90.3 | 66.8 | 44.2 | . | 7.4 |
| South Africa | 2009 | 76.4 | 70.4 | 35.7 | 11.8 | 0.7 |
| Tanzania | 2002 | 48.9 | 6.0 | 1.6 | . | 0.9 |
| Uganda | 2008 | 34.6 | 23.4 | 8.7 | 6.8 | 1.8 |
| Zimbabwe | 2002 | 65.1 | 45.9 | 10.3 | 9.1 | 1.5 |
When interpreting the educational attainment data for sub-Saharan Africa it is necessary to consider that the reported values for some countries are more than a decade old. As younger, more educated cohorts reach age 25, the average attainment rates of the population 25 years and older increase and the situation of some countries is therefore likely to have improved since the year of reporting. In addition, the picture is incomplete because for 30 of the 45 countries in the sub-Saharan Africa region, as defined by UIS, no educational attainment data is available in the UIS Data Centre.
Reference
- UNESCO Institute for Statistics (UIS). 2011. Global Education Digest 2011: Comparing Education Statistics Across the World. Montreal: UIS. (Download in PDF format, 7.5 MB)
Related articles
- Global Education Digest 2011
- Adult literacy in sub-Saharan Africa
- Education finance in sub-Saharan Africa
- School attendance by grade and age in Liberia
- Educational attainment in Brazil since 1920
- Educational attainment in India, 1950-2000
- Educational attainment in the United States, 1940-2009
- Poverty and educational attainment in the United States
- Poverty and educational attainment in the United States, part 2
- National wealth and years of education
- Regional disparities in school life expectancy
- Education and democracy
Permanent URL: http://huebler.blogspot.com/2012/02/ssa.html
Thursday, November 17, 2011
Transactions on Kenya's M-Pesa mobile money service exceed transactions made by Western Union globally
"Local transactions by Kenya’s mobile money service, M-Pesa currently exceed transactions made by Western Union globally, the International Monetary Fund (IMF) reports. According to the IMF, “M-Pesa now processes more transactions domestically within Kenya than Western Union does globally, and provides mobile banking facilities to more than 70 per cent of the country’s adult population.”
Launched in March 2007 by Kenyan telecoms operator, Safaricom, the service which now has over 14 million users in Kenya is currently the world’s most successful mobile payments system."
Launched in March 2007 by Kenyan telecoms operator, Safaricom, the service which now has over 14 million users in Kenya is currently the world’s most successful mobile payments system."
Source: TheNextWeb, 24th October 2011
Wednesday, October 12, 2011
18% of internet users access solely through a mobile connection
"Mobile is increasingly the primary platform for internet access, according to today’s Global Consumer Survey (GCS) report from MEF, the global community for mobile content and commerce.
Based on research conducted among over 8,000 respondents in nine countries across five continents, the MEF GCS found that 72% access the mobile internet on a daily basis with 18% no longer using fixed line internet access whatsoever. In each individual market, the number of consumers accessing the mobile internet daily is higher than the number accessing fixed-line internet."
Based on research conducted among over 8,000 respondents in nine countries across five continents, the MEF GCS found that 72% access the mobile internet on a daily basis with 18% no longer using fixed line internet access whatsoever. In each individual market, the number of consumers accessing the mobile internet daily is higher than the number accessing fixed-line internet."
Source: Research by the Mobile Entertainment Forum (MEF)'s Global Consumer Survey, reported in a press release, 12th October 2011
See an extract here
The markets surveyed were: Brazil, Egypt, India, Indonesia, Qatar, Singapore, South Africa, UK & US
Friday, September 30, 2011
Adult and youth literacy in 2009
8 September was International Literacy Day. On this occasion, the UNESCO Institute for Statistics (UIS) released a fact sheet with estimates of adult and youth literacy in 2009, the most recent year with data.
The global adult literacy rate, for the population 15 years and older, was 83.7% in 2009, compared to 83.4% in 2008. The adult illiterate population fell from 796.2 million in 2008 to 793.1 million in 2009. 64.1% of the adult illiterate population were women. Adult literacy rates are lowest in sub-Saharan African and in South and West Asia (see Figure 1). In 11 countries, less than half of the adult population were able to read and write: Benin, Burkina Faso, Chad, Ethiopia, Gambia, Guinea, Haiti, Mali, Niger, Senegal and Sierra Leone.
Figure 1: Adult literacy rate, 2009

Source: UNESCO Institute for Statistics, 2011
Youth literacy rates - for the population 15 to 24 years - are generally higher than adult literacy rates, due to increased school attendance rates among younger generations. The global youth literacy rate was 89.3% in 2009, compared to 89.0% in 2008. The youth illiterate population fell from 130.6 million in 2008 to 127.3 million in 2009. Youth literacy rates are lowest in sub-Saharan Africa (see Figure 2) and the five countries worldwide with youth literacy rates below 50% are from this region: Burkina Faso, Chad, Ethiopia, Mali and Niger.
Figure 2: Youth literacy rate, 2009

Source: UNESCO Institute for Statistics, 2011
Reference
Friedrich Huebler, 30 September 2011, Creative Commons License
Permanent URL: http://huebler.blogspot.com/2011/09/literacy.html
The global adult literacy rate, for the population 15 years and older, was 83.7% in 2009, compared to 83.4% in 2008. The adult illiterate population fell from 796.2 million in 2008 to 793.1 million in 2009. 64.1% of the adult illiterate population were women. Adult literacy rates are lowest in sub-Saharan African and in South and West Asia (see Figure 1). In 11 countries, less than half of the adult population were able to read and write: Benin, Burkina Faso, Chad, Ethiopia, Gambia, Guinea, Haiti, Mali, Niger, Senegal and Sierra Leone.
Figure 1: Adult literacy rate, 2009
Source: UNESCO Institute for Statistics, 2011
Youth literacy rates - for the population 15 to 24 years - are generally higher than adult literacy rates, due to increased school attendance rates among younger generations. The global youth literacy rate was 89.3% in 2009, compared to 89.0% in 2008. The youth illiterate population fell from 130.6 million in 2008 to 127.3 million in 2009. Youth literacy rates are lowest in sub-Saharan Africa (see Figure 2) and the five countries worldwide with youth literacy rates below 50% are from this region: Burkina Faso, Chad, Ethiopia, Mali and Niger.
Figure 2: Youth literacy rate, 2009
Source: UNESCO Institute for Statistics, 2011
Reference
- UNESCO Institute for Statistics (UIS). 2011. Adult and youth literacy. UIS fact sheet no. 16, September. Montreal: UIS. (Download in PDF format, 350 KB)
- Trends in adult literacy, 1990-2008
- Literacy data from the UNESCO Institute for Statistics
- Adult literacy in 2007
- Disparity between male and female literacy rates
- Disparity between adult and youth literacy
- Adult literacy in Sub-Saharan Africa
Friedrich Huebler, 30 September 2011, Creative Commons License
Permanent URL: http://huebler.blogspot.com/2011/09/literacy.html
Sunday, July 31, 2011
School attendance by grade and age in Liberia
The article "Overage pupils in primary and secondary education" of June 2011 summarized data on school attendance from 36 countries and found that overage school attendance is common in sub-Saharan Africa. The countries with the highest share of overage pupils in the sample were Haiti, Liberia, Uganda, Rwanda, Cambodia, Ethiopia, Ghana, Madagascar, and Malawi. In Liberia, 93% of all pupils in primary and secondary education are at least one year overage for their grade and 84% are at least two years overage. This article takes a closer look at Liberia by analyzing data from the same Demographic and Health Survey (DHS) from 2007 that was analyzed for the earlier article.
The official primary school age in Liberia, as defined by the International Standard Classification of Education (ISCED), is 6 to 11 years. The official secondary school age is 12 to 17 years. Given these school ages, a 6-year-old in grade 1 and a 7-year-old in grade 2 are in the right grade for their age. A 7-year-old in grade 1 would be one year overage and an 8-year-old in grade 1 would be two years overage. A 5-year-old in grade 1 would be one year underage.
The graph below shows the age distribution of pupils in primary and secondary education in Liberia. Pupils who are in the right grade for their age or underage are in a small minority. In the first twelve grades, their share never exceeds 9%. By contrast, as many as 98% of all pupils in a single grade are overage. The degree of overage attendance is astounding: 5% of all first graders are 9 or more years overage, meaning that they start primary school at age 15 or later. 19% of all first graders are at least 7 years overage and 44% are at least 5 years overage. In grade 8, 18% of all pupils are 9 or more years overage; while the official age for eighth graders is 13 years, one in five pupils in that grade in Liberia is 22 years or older.
Age distribution of pupils in primary and secondary education in Liberia, 2007
Source: Demographic and Health Survey (DHS) 2007. - Click image to enlarge.
What are the reasons for this high prevalence of overage school attendance? In Liberia, as in other countries of sub-Saharan Africa, many pupils enter school late for a variety of reasons that include poverty, a scarcity of educational facilities, and lack of enforcement of the official school ages. High repetition rates further exacerbate the problem of overage school attendance. Among the consequences of this age structure in school are a higher probability of dropout and reduced lifetime earnings caused by incomplete education or late entry into the labor market.
Related articles
Friedrich Huebler, 31 July 2011 (edited 27 February 2012), Creative Commons License
Permanent URL: http://huebler.blogspot.com/2011/07/liberia.html
The official primary school age in Liberia, as defined by the International Standard Classification of Education (ISCED), is 6 to 11 years. The official secondary school age is 12 to 17 years. Given these school ages, a 6-year-old in grade 1 and a 7-year-old in grade 2 are in the right grade for their age. A 7-year-old in grade 1 would be one year overage and an 8-year-old in grade 1 would be two years overage. A 5-year-old in grade 1 would be one year underage.
The graph below shows the age distribution of pupils in primary and secondary education in Liberia. Pupils who are in the right grade for their age or underage are in a small minority. In the first twelve grades, their share never exceeds 9%. By contrast, as many as 98% of all pupils in a single grade are overage. The degree of overage attendance is astounding: 5% of all first graders are 9 or more years overage, meaning that they start primary school at age 15 or later. 19% of all first graders are at least 7 years overage and 44% are at least 5 years overage. In grade 8, 18% of all pupils are 9 or more years overage; while the official age for eighth graders is 13 years, one in five pupils in that grade in Liberia is 22 years or older.
Age distribution of pupils in primary and secondary education in Liberia, 2007
Source: Demographic and Health Survey (DHS) 2007. - Click image to enlarge.
What are the reasons for this high prevalence of overage school attendance? In Liberia, as in other countries of sub-Saharan Africa, many pupils enter school late for a variety of reasons that include poverty, a scarcity of educational facilities, and lack of enforcement of the official school ages. High repetition rates further exacerbate the problem of overage school attendance. Among the consequences of this age structure in school are a higher probability of dropout and reduced lifetime earnings caused by incomplete education or late entry into the labor market.
Related articles
- School attendance among 5- to 24-year-olds in Liberia
- Overage pupils in primary and secondary education
- Official school ages: primary, secondary, and compulsory education
- Primary school entrance age and duration
- Repetition rates in primary and secondary school
- Survival rate to the last grade of primary school
- Transition from primary to secondary education
- Regional disparities in school life expectancy
- Educational attainment in sub-Saharan Africa
- Children of primary and secondary school age out of school
- Children out of school: Global trend 1999-2008
- Household wealth and years of education
- National wealth and years of education
- National wealth and school enrollment
- Review of the International Standard Classification of Education (ISCED)
Friedrich Huebler, 31 July 2011 (edited 27 February 2012), Creative Commons License
Permanent URL: http://huebler.blogspot.com/2011/07/liberia.html
Thursday, June 30, 2011
Overage pupils in primary and secondary education
Pupils can be overage for their grade for two reasons: late entry and repetition. Take for example a country where children are expected to enter primary school at 6 years of age. If a child enters grade 1 at age 7, he or she is one year overage for the grade. A child who enters grade 1 at age 8 and repeats the grade will be three years overage for the grade; two of the three years are due to late entry and the third year is due to repetition.
Children who are many years overage are less likely to complete their education. If they stay in school, they graduate later than pupils who entered school at the official starting age. These overage graduates enter the labor market late and often with lower educational attainment. As a consequence, they are likely to have lower cumulative earnings over their lifetime than persons who graduated and entered the labor market at a younger age and with higher educational attainment. For the country as a whole this in turn means reduced national income and slower economic growth.
Overage school attendance is common in sub-Saharan Africa but also occurs in other regions. The figure below shows data from 36 nationally representative household surveys that were conducted between 2004 and 2009. 34 of these surveys were Demographic and Health Surveys (DHS) and the remaining two surveys, those for Bangladesh and Kyrgyzstan, were Multiple Indicator Cluster Surveys (MICS). For each country, the graph shows the share of children in primary and secondary education who are at least one or two years overage for their grade. The entrance ages and durations of primary and secondary education used in this study are those specified by the International Standard Classification of Education (ISCED).
Percentage of children in primary and secondary education who are at least 1 or 2 years overage for their grade

Source: Demographic and Health Surveys (DHS) and Multiple Indicator Cluster Surveys (MICS), 2004-2009.
In the sample of 36 countries, the share of children who are at least one year overage for their grade ranges from 5 percent in Armenia to 95 percent in Haiti. Other countries where at least three out of four pupils in primary or secondary education are overage include Liberia (93%), Uganda (86%), Rwanda (83%), Cambodia (78%), Mozambique (76%), and Ethiopia (75%). In addition to Armenia, the percentage of pupils who are at least one year overage is below 10 percent in Moldova and Egypt (8%).
The share of children in primary and secondary education who are at least two years overage for their grade ranges from 1 percent in Armenia to 85 percent in Haiti. In addition to Haiti, at least half of all pupils are two or more years overage in Liberia (84%), Uganda (67%), Rwanda (65%), Ethiopia (59%), Cambodia (55%), Malawi (51%), and Madagascar (50%). On average, the share of children who are at least two years overage is 19 percent less than the share of children who are at least one year overage.
However, there are exceptions. In Albania and the Ukraine, 43 and 26 percent respectively of all children in primary and secondary education are at least one year overage. By contrast, only 5 and 2 percent respectively are at least two years overage. This means that in these two countries, a relatively large number of children enter school one year late or repeat one grade, but hardly any children enter school two years late or repeat more than one grade. Late entry and repetition are therefore less likely to have negative consequences on lifetime earnings and national income in Albania and the Ukraine than in other countries.
Related articles
Permanent URL: http://huebler.blogspot.com/2011/06/age.html
Children who are many years overage are less likely to complete their education. If they stay in school, they graduate later than pupils who entered school at the official starting age. These overage graduates enter the labor market late and often with lower educational attainment. As a consequence, they are likely to have lower cumulative earnings over their lifetime than persons who graduated and entered the labor market at a younger age and with higher educational attainment. For the country as a whole this in turn means reduced national income and slower economic growth.
Overage school attendance is common in sub-Saharan Africa but also occurs in other regions. The figure below shows data from 36 nationally representative household surveys that were conducted between 2004 and 2009. 34 of these surveys were Demographic and Health Surveys (DHS) and the remaining two surveys, those for Bangladesh and Kyrgyzstan, were Multiple Indicator Cluster Surveys (MICS). For each country, the graph shows the share of children in primary and secondary education who are at least one or two years overage for their grade. The entrance ages and durations of primary and secondary education used in this study are those specified by the International Standard Classification of Education (ISCED).
Percentage of children in primary and secondary education who are at least 1 or 2 years overage for their grade
Source: Demographic and Health Surveys (DHS) and Multiple Indicator Cluster Surveys (MICS), 2004-2009.
In the sample of 36 countries, the share of children who are at least one year overage for their grade ranges from 5 percent in Armenia to 95 percent in Haiti. Other countries where at least three out of four pupils in primary or secondary education are overage include Liberia (93%), Uganda (86%), Rwanda (83%), Cambodia (78%), Mozambique (76%), and Ethiopia (75%). In addition to Armenia, the percentage of pupils who are at least one year overage is below 10 percent in Moldova and Egypt (8%).
The share of children in primary and secondary education who are at least two years overage for their grade ranges from 1 percent in Armenia to 85 percent in Haiti. In addition to Haiti, at least half of all pupils are two or more years overage in Liberia (84%), Uganda (67%), Rwanda (65%), Ethiopia (59%), Cambodia (55%), Malawi (51%), and Madagascar (50%). On average, the share of children who are at least two years overage is 19 percent less than the share of children who are at least one year overage.
However, there are exceptions. In Albania and the Ukraine, 43 and 26 percent respectively of all children in primary and secondary education are at least one year overage. By contrast, only 5 and 2 percent respectively are at least two years overage. This means that in these two countries, a relatively large number of children enter school one year late or repeat one grade, but hardly any children enter school two years late or repeat more than one grade. Late entry and repetition are therefore less likely to have negative consequences on lifetime earnings and national income in Albania and the Ukraine than in other countries.
Related articles
- Official school ages: primary, secondary, and compulsory education
- Primary school entrance age and duration
- Repetition rates in primary and secondary school
- Survival rate to the last grade of primary school
- Transition from primary to secondary education
- Regional disparities in school life expectancy
- Children of primary and secondary school age out of school
- Children out of school: Global trend 1999-2008
- Household wealth and years of education
- National wealth and years of education
- National wealth and school enrollment
- Poverty and educational attainment in the United States
- Poverty and educational attainment in the United States, part 2
- Review of the International Standard Classification of Education (ISCED)
- Demographic and Health Surveys (DHS)
- Multiple Indicator Cluster Surveys (MICS)
- International Standard Classification of Education (ISCED)
Permanent URL: http://huebler.blogspot.com/2011/06/age.html
Tuesday, May 31, 2011
Education finance in sub-Saharan Africa
 A new report by the UNESCO Institute for Statistics, Financing education in sub-Saharan Africa, presents comprehensive data for the past decade for 45 African countries.
The number of children enrolled in primary school in sub-Saharan Africa grew from 87 million in 2000 to 129 million in 2008, an increase of 48 percent. Over the 1999-2009 decade, real public expenditure on education, adjusted for inflation, grew on average by 6.1 percent per year, based on data from 26 countries. The highest annual growth rates of education spending in sub-Saharan Africa, over 12 percent, were observed in Mozambique and Burundi. Of the countries with data, only the Central African Republic experienced a decline in public expenditure on education.
The countries of sub-Saharan Africa combined spend 5.0 percent of their GDP on education, the second highest value of the eight EFA regions, after North America and Western Europe, where 5.3 percent of the regional GDP is spent on the education sector.
The figure below shows data on education expenditure in 28 countries in sub-Saharan Africa. The horizontal axis indicates a country's total public expenditure as a percentage of gross domestic product (GDP). The vertical axis indicates a country's total public expenditure on education as a percentage of total public expenditure. Total public expenditure on education as a percentage of GDP can be calculated as the product of the two values plotted along the vertical and horizontal axes.
Public education expenditure / GDP =
(Public education expenditure / Total public expenditure) × (Total public expenditure / GDP)
(Public education expenditure / Total public expenditure) × (Total public expenditure / GDP)
The three curves in the graph indicate where total public expenditure on education is equal to 2, 5 or 10 percent of GDP. Countries with higher expenditures on education as a percentage of GDP are found near the upper right corner of the graph, countries with lower expenditures near the lower left corner. For the countries in the graph, public expenditure on education as a percentage of GDP ranges from 1.3 percent in the Central Africal Republic to 12.4 percent in Lesotho.
Total public expenditure on education as a percentage of total public expenditure in relation to total public expenditure as a percentage of GDP

Source: UIS 2011, page 30, Figure 11
Reference
- UNESCO Institute for Statistics (UIS). 2011. Financing education in sub-Saharan Africa: Meeting the challenges of expansion, equity and quality. Montreal: UIS. (Download in PDF format, 8.7 MB)
- Announcement of the publication Financing education in sub-Saharan Africa on the UIS website
- UNESCO Institute for Statistics (UIS)
- EFA Global Monitoring Report 2011
- Global Education Digest 2010
- Education for All regions
- National wealth and years of education
- National wealth and school enrollment
- Children out of school: Global trend 1999-2008
- Educational attainment in sub-Saharan Africa
Permanent URL: http://huebler.blogspot.com/2011/05/ssa.html
Tuesday, February 22, 2011
99% of internet access in Kenya is through mobile operators
"Highlights of Q4 2010:
There are 22 million mobile subscribers in Kenya
9.5% mobile subscriptions growth, which is increasing over the previous quarters
6.63 billion minutes of local calls were made on the mobile networks
740 million text messages were sent
Prepaid accounts for 99% of the total mobile subscriptions
The number of internet users was estimated at 8.69 million
The number of internet/data subscriptions is 3.2 million
Broadband subscriptions increased from 18,626 subscribers in the previous quarter to 84,726"
[...]
"A whopping 99% of the internet traffic in Kenya is done via mobile operators, meaning 3G, Edge or GPRS."
There are 22 million mobile subscribers in Kenya
9.5% mobile subscriptions growth, which is increasing over the previous quarters
6.63 billion minutes of local calls were made on the mobile networks
740 million text messages were sent
Prepaid accounts for 99% of the total mobile subscriptions
The number of internet users was estimated at 8.69 million
The number of internet/data subscriptions is 3.2 million
Broadband subscriptions increased from 18,626 subscribers in the previous quarter to 84,726"
[...]
"A whopping 99% of the internet traffic in Kenya is done via mobile operators, meaning 3G, Edge or GPRS."
Source: The latest Communications Commission of Kenya report, reported by White African, 18th February 2011
Hat-tip Interesting Snippets
Tuesday, December 14, 2010
More than 50% of internet users in Africa use mobile as their main internet connection
"Data from mobile survey company, On Device Research, has put some meat on the bones of some industry received wisdom – that people in emerging markets overwhelmingly used mobile devices and not the PC to connect to the internet.
Here are the main stats.
The percentage of mobile internet browsers who never or infrequently use the desktop Internet
US - 25%
UK - 22%
Egypt - 70%
India - 59%
South Africa - 57%
Ghana - 55%
Kenya - 54%
Nigeria - 50%
Indonesia - 44%
Thailand - 32%
China - 30%
Russia - 19%
Asia (India, China, Indonesia, Thailand) - 43%
Africa (South Africa, Egypt, Ghana, Nigeria, Kenya) - 56%
* Infrequent mobile internet browsers use it once a month or less"
Source: Data from On Device Research, reported by Mobile Entertainment, 14th December 2010
Here are the main stats.
The percentage of mobile internet browsers who never or infrequently use the desktop Internet
US - 25%
UK - 22%
Egypt - 70%
India - 59%
South Africa - 57%
Ghana - 55%
Kenya - 54%
Nigeria - 50%
Indonesia - 44%
Thailand - 32%
China - 30%
Russia - 19%
Asia (India, China, Indonesia, Thailand) - 43%
Africa (South Africa, Egypt, Ghana, Nigeria, Kenya) - 56%
* Infrequent mobile internet browsers use it once a month or less"
Source: Data from On Device Research, reported by Mobile Entertainment, 14th December 2010
Tuesday, November 30, 2010
Children out of school: Global trend 1999-2008
68 million children of primary school age were out of school in 2008 according to estimates by the UNESCO Institute for Statistics (UIS). Compared to 1999, when 106 million children were out of school, this is a decrease of over 38 million (see Figure 1). However, in spite of the observed progress over the last decade, the Millennium Development Goal of universal primary education by 2015 will not be reached if current trends continue unchanged.
Figure 1: Children of primary school age out of school, 1999-2008

Source: UNESCO Institute for Statistics, Data Centre, November 2010.
The UIS also publishes data on the regional distribution of children out of school, but complete data are only available until 2007. 43 percent - 30.4 million - of all children out of school in 2007 lived in sub-Saharan Africa (see Figure 2). A further 25 percent - 17.7 million - lived in South and West Asia. These two regions combined accounted for two thirds of the global out-of-school population. The shares of the remaining regions were as follows: 13 percent of all children out of school lived in East Asia and the Pacific, 9 percent in the Arab States, 4 percent in Latin America and the Caribbean, 3 percent in North America and Western Europe, 2 percent in Central and Eastern Europe, and less than 1 percent in Central Asia.
Figure 2: Regional distribution of children out of school, 2007

Source: UNESCO Institute for Statistics, Data Centre, November 2010.
Regional and global estimates of the number of children out of school can be obtained from the UIS Data Centre. On the main Data Centre page at stats.uis.unesco.org, click on Predefined Tables and then Education. Table 20H, "Regional sum of primary school age children out of school", lists the total, male and female number of children of primary school age out of school for the period 1999 to 2008.
Related articles
Friedrich Huebler, 30 November 2010 (edited 17 December 2010), Creative Commons License
Permanent URL: http://huebler.blogspot.com/2010/11/oos.html
Figure 1: Children of primary school age out of school, 1999-2008
Source: UNESCO Institute for Statistics, Data Centre, November 2010.
The UIS also publishes data on the regional distribution of children out of school, but complete data are only available until 2007. 43 percent - 30.4 million - of all children out of school in 2007 lived in sub-Saharan Africa (see Figure 2). A further 25 percent - 17.7 million - lived in South and West Asia. These two regions combined accounted for two thirds of the global out-of-school population. The shares of the remaining regions were as follows: 13 percent of all children out of school lived in East Asia and the Pacific, 9 percent in the Arab States, 4 percent in Latin America and the Caribbean, 3 percent in North America and Western Europe, 2 percent in Central and Eastern Europe, and less than 1 percent in Central Asia.
Figure 2: Regional distribution of children out of school, 2007
Source: UNESCO Institute for Statistics, Data Centre, November 2010.
Regional and global estimates of the number of children out of school can be obtained from the UIS Data Centre. On the main Data Centre page at stats.uis.unesco.org, click on Predefined Tables and then Education. Table 20H, "Regional sum of primary school age children out of school", lists the total, male and female number of children of primary school age out of school for the period 1999 to 2008.
Related articles
- Children of primary and secondary school age out of school
- Global population of primary school age, 2000-2015
- Population structure and children out of school
- National wealth and school enrollment
- Regional disparities in school life expectancy
- Universal primary education by 2015: A goal out of reach?
Friedrich Huebler, 30 November 2010 (edited 17 December 2010), Creative Commons License
Permanent URL: http://huebler.blogspot.com/2010/11/oos.html
Friday, November 19, 2010
There are 506m mobile subscriptions in Africa
"The number of active mobile subscriptions in Africa crossed the half-a-billion mark in the third quarter of this year, to reach 506 million at end-September, according to research by UK-based Informa Telecoms & Media.
The report, published on the researcher’s website said at the end of the third quarter of this year, Africa accounted for 10% of the world’s mobile subscriptions and was one of the world’s fastest-growing regions – with the subscription numbers increasing 18% over the year to September."
Source: Data from Informa Telecoms & Media, reported by PeaceFM Online, 14th November 2010
[Note - the story is not easily accessible on the Informa website]
The report, published on the researcher’s website said at the end of the third quarter of this year, Africa accounted for 10% of the world’s mobile subscriptions and was one of the world’s fastest-growing regions – with the subscription numbers increasing 18% over the year to September."
Source: Data from Informa Telecoms & Media, reported by PeaceFM Online, 14th November 2010
[Note - the story is not easily accessible on the Informa website]
Wednesday, July 21, 2010
Africa accounted for 12% of all net new mobile subscribers in Q1 2010
"Africa accounted for 12 percent of global mobile net additions in 1Q 2010, adding 20.1 million new subscribers to the world population of mobile users, and giving Africa a total of 480.2 million subscribers. This is a rather neat 10.0 percent of the some 4.82 billion mobile subscribers estimated to exist at the end of March 2010.
By comparison the Middle East accounted for 5 percent of global mobile net additions, clocking up some 8.1 million in the first quarter. Together Africa & the Middle East therefore accounted for 17 percent of global net additions.
According to research by The Mobile World, 1Q 2010 saw net additions of 168 million, taking the total to 4.82 billion. China and India remain the world's largest, and accounted for almost 28 percent of the global total at the end of 1Q 2010, but their contribution to the net quarterly gain in connections was double this at 56 percent. The USA accounts for 3 percent of net additions: the same percentage as Brazil and Russia combined.
With the world population at around 6.8 billion, the global mobile penetration rate stood at just under 71 percent at the end of Q1 2010. Africa, by comparison, had a mobile penetration of 47 percent, whilst the Middle East hit 86 percent."
Source: Worldwide Mobile Market Growth, Africa and Middle East Telecom Week, July 2010
By comparison the Middle East accounted for 5 percent of global mobile net additions, clocking up some 8.1 million in the first quarter. Together Africa & the Middle East therefore accounted for 17 percent of global net additions.
According to research by The Mobile World, 1Q 2010 saw net additions of 168 million, taking the total to 4.82 billion. China and India remain the world's largest, and accounted for almost 28 percent of the global total at the end of 1Q 2010, but their contribution to the net quarterly gain in connections was double this at 56 percent. The USA accounts for 3 percent of net additions: the same percentage as Brazil and Russia combined.
With the world population at around 6.8 billion, the global mobile penetration rate stood at just under 71 percent at the end of Q1 2010. Africa, by comparison, had a mobile penetration of 47 percent, whilst the Middle East hit 86 percent."
Source: Worldwide Mobile Market Growth, Africa and Middle East Telecom Week, July 2010
Sunday, March 28, 2010
Children of primary and secondary school age out of school
The UNESCO Institute for Statistics (UIS) publishes annual estimates of the number of children of primary school age out of school. A recent paper by Michael Bruneforth and Peter Wallet, Out-of-school adolescents (UIS 2010), extends the analysis to children of lower secondary school age. Any child enrolled in primary, secondary or tertiary education is considered in school, regardless of the child's age. Only children that are truly excluded from education are counted as out of school.
The paper's regional and global estimates of the number and percent of children out of school are reproduced in this article. Table 1 lists the population of primary and lower secondary school age in 2007. Worldwide there were about 653 million children of primary school age and 388 million children of lower secondary school age. More than half of these children lived in South and West Asia and East Asia and the Pacific.
Table 1: Population of primary and lower secondary school age by region (million), 2007
Source: UIS 2010, page 10, Table 1; author's calculations. - Note: Figures may not sum due to rounding.
Figure 1 illustrates the regional distribution of the population of primary and lower secondary school age. The number of children in these age groups is plotted along the horizontal axis. The vertical axis indicates the share of children of primary and lower secondary school age in each region. The regions with the largest number of school-age children in 2007 were South and West Asia (284 million), East Asia and the Pacific (281 million), and Sub-Saharan Africa (183 million). More than 60 percent of the combined population of primary and lower secondary school age were of primary school age. Central Asia and Central and Eastern Europe were exceptions, with a greater share of children of lower secondary school age than in other regions. The large share of primary-age children in Sub-Saharan Africa is a symptom of its high population growth rate.
Figure 1: Population of primary and lower secondary school age by region, 2007

Source: UIS 2010, page 10, Table 1; author's calculations. - CEE: Central and Eastern Europe, NAWE: North America and Western Europe, LAC: Latin America and the Caribbean.
The share and number of children out of school are listed in Table 2. At the global level, 11 percent or 72 million of all children of primary school age and 18 percent or 71 million of all children of lower secondary school age were out of school. The combined global share of children out of school was 14 percent. Out-of-school rates were highest in Sub-Saharan Africa, where 26 percent of all primary school-age children and 37 percent of all secondary school-age children were excluded from education.
Table 2: Children of primary and lower secondary school age out of school by region, 2007
Source: UIS 2010, page 10, Table 1.
As illustrated in Figure 2, out-of-school rates are always higher at the secondary level of education than at the primary level. This is not surprising because not all students complete primary education and not all of those who graduate from primary school transfer to secondary school to continue their education. In addition to Sub-Saharan Africa, South and West Asia (27 percent) and the Arab States (20 percent) also had a high share of children of secondary school age out of school.
Figure 2: Children of primary and lower secondary school age out of school by region, 2007

Source: UIS 2010, page 10, Table 1.
The distribution of children out of school by region in 2007 is shown in Figure 3. A comparison with the population distribution in Figure 1 makes clear that children from Sub-Saharan Africa and South and West Asia were disproportionately more likely to be out of school than children from other regions. More than two thirds of the 143 million out-of-school children of primary and lower secondary age were from Sub-Saharan Africa (54 million) and South and West Asia (47 million). 20 million children out of school lived in East Asia and 10 million in the Arab States. The remaining 13 million children out of school were from Latin America and the Caribbean (5 million), Central and Eastern Europe (3.5 million), North America and Western Europe (3.3 million), and Central Asia (0.7 million).
Figure 3: Children of primary and lower secondary school age out of school by region, 2007

Source: UIS 2010, page 10, Table 1. - CEE: Central and Eastern Europe, NAWE: North America and Western Europe, LAC: Latin America and the Caribbean.
In Sub-Saharan Africa, the Arab States, North America and Western Europe, and Latin America and the Caribbean most children out of school were of primary age. In South and West Asia, East Asia, and Central and Eastern Europe most children out of school were of lower secondary age. At the global level, the number of out-of-school children of primary school age and lower secondary school age was roughly equal (see Table 2).
References
Friedrich Huebler, 28 March 2010 (edited 17 August 2011), Creative Commons License
Permanent URL: http://huebler.blogspot.com/2010/03/coos.html
The paper's regional and global estimates of the number and percent of children out of school are reproduced in this article. Table 1 lists the population of primary and lower secondary school age in 2007. Worldwide there were about 653 million children of primary school age and 388 million children of lower secondary school age. More than half of these children lived in South and West Asia and East Asia and the Pacific.
Table 1: Population of primary and lower secondary school age by region (million), 2007
| Region | Primary | Lower secondary | Total |
| Sub-Saharan Africa | 124.9 | 57.9 | 182.7 |
| Arab States | 41.4 | 21.9 | 63.5 |
| South and West Asia | 176.8 | 106.8 | 284.2 |
| Central Asia | 5.6 | 8.0 | 13.8 |
| East Asia and the Pacific | 173.8 | 106.5 | 281.2 |
| Central and Eastern Europe | 22.2 | 20.3 | 42.1 |
| North America and Western Europe | 50.8 | 31.0 | 81.6 |
| Latin America and the Caribbean | 58.6 | 35.9 | 93.7 |
| World | 652.6 | 388.2 | 1042.5 |
Figure 1 illustrates the regional distribution of the population of primary and lower secondary school age. The number of children in these age groups is plotted along the horizontal axis. The vertical axis indicates the share of children of primary and lower secondary school age in each region. The regions with the largest number of school-age children in 2007 were South and West Asia (284 million), East Asia and the Pacific (281 million), and Sub-Saharan Africa (183 million). More than 60 percent of the combined population of primary and lower secondary school age were of primary school age. Central Asia and Central and Eastern Europe were exceptions, with a greater share of children of lower secondary school age than in other regions. The large share of primary-age children in Sub-Saharan Africa is a symptom of its high population growth rate.
Figure 1: Population of primary and lower secondary school age by region, 2007
Source: UIS 2010, page 10, Table 1; author's calculations. - CEE: Central and Eastern Europe, NAWE: North America and Western Europe, LAC: Latin America and the Caribbean.
The share and number of children out of school are listed in Table 2. At the global level, 11 percent or 72 million of all children of primary school age and 18 percent or 71 million of all children of lower secondary school age were out of school. The combined global share of children out of school was 14 percent. Out-of-school rates were highest in Sub-Saharan Africa, where 26 percent of all primary school-age children and 37 percent of all secondary school-age children were excluded from education.
Table 2: Children of primary and lower secondary school age out of school by region, 2007
| Region | Primary | Lower secondary | Total | |||
| Percent | Million | Percent | Million | Percent | Million | |
| Sub-Saharan Africa | 25.8 | 32.2 | 36.8 | 21.3 | 29.3 | 53.5 |
| Arab States | 13.9 | 5.8 | 19.5 | 4.3 | 15.8 | 10.0 |
| South and West Asia | 10.2 | 18.0 | 27.3 | 29.1 | 16.6 | 47.2 |
| Central Asia | 4.8 | 0.3 | 4.9 | 0.4 | 4.8 | 0.7 |
| East Asia and the Pacific | 5.2 | 9.0 | 10.0 | 10.6 | 7.0 | 19.7 |
| Central and Eastern Europe | 7.0 | 1.6 | 9.6 | 1.9 | 8.3 | 3.5 |
| North America and Western Europe | 3.8 | 1.9 | 4.3 | 1.3 | 4.0 | 3.3 |
| Latin America and the Caribbean | 5.1 | 3.0 | 5.5 | 2.0 | 5.3 | 5.0 |
| World | 11.0 | 71.8 | 18.3 | 71.0 | 13.7 | 142.8 |
As illustrated in Figure 2, out-of-school rates are always higher at the secondary level of education than at the primary level. This is not surprising because not all students complete primary education and not all of those who graduate from primary school transfer to secondary school to continue their education. In addition to Sub-Saharan Africa, South and West Asia (27 percent) and the Arab States (20 percent) also had a high share of children of secondary school age out of school.
Figure 2: Children of primary and lower secondary school age out of school by region, 2007
Source: UIS 2010, page 10, Table 1.
The distribution of children out of school by region in 2007 is shown in Figure 3. A comparison with the population distribution in Figure 1 makes clear that children from Sub-Saharan Africa and South and West Asia were disproportionately more likely to be out of school than children from other regions. More than two thirds of the 143 million out-of-school children of primary and lower secondary age were from Sub-Saharan Africa (54 million) and South and West Asia (47 million). 20 million children out of school lived in East Asia and 10 million in the Arab States. The remaining 13 million children out of school were from Latin America and the Caribbean (5 million), Central and Eastern Europe (3.5 million), North America and Western Europe (3.3 million), and Central Asia (0.7 million).
Figure 3: Children of primary and lower secondary school age out of school by region, 2007
Source: UIS 2010, page 10, Table 1. - CEE: Central and Eastern Europe, NAWE: North America and Western Europe, LAC: Latin America and the Caribbean.
In Sub-Saharan Africa, the Arab States, North America and Western Europe, and Latin America and the Caribbean most children out of school were of primary age. In South and West Asia, East Asia, and Central and Eastern Europe most children out of school were of lower secondary age. At the global level, the number of out-of-school children of primary school age and lower secondary school age was roughly equal (see Table 2).
References
- UNESCO Institute for Statistics (UIS). 2010. Out-of-school adolescents. Montreal: UIS.
- Announcement of paper on UIS website
- Download English version (PDF, 208 KB)
- Download French version: Adolescents non scolarisés (PDF, 216 KB)
- Figures 1 and 3 were created with the spineplot add-on for Stata by Nicholas Cox.
- Cox, Nicholas J. 2008. "Speaking Stata: Spineplots and their kin." Stata Journal 8 (1): 105-121. http://www.stata-journal.com/article.html?article=gr0031
- Global population of primary school age, 2000-2015
- Population structure and children out of school
- National wealth and years of education
- National wealth and school enrollment
- Survival rate to the last grade of primary school
- Transition from primary to secondary education
- Regional disparities in school life expectancy
- School life expectancy
- Universal primary education by 2015: A goal out of reach?
- Trends in primary school enrollment, 1970-2004
- Regional trends in secondary school enrollment, 1980-2000
- Official school ages: primary, secondary, and compulsory education
Friedrich Huebler, 28 March 2010 (edited 17 August 2011), Creative Commons License
Permanent URL: http://huebler.blogspot.com/2010/03/coos.html
Sunday, February 8, 2009
Population structure and children out of school
Sub-Saharan Africa is the region with the highest percentage of children out of school. At the same time, the population of most countries in Sub-Saharan Africa is increasing and children of primary school age constitute a large and growing share of the population.
The link between the population structure and the number of children out of school is shown in the figures and table below. Data on the share of children of primary school age out of school were obtained from the Childinfo website of UNICEF. The official primary school ages in individual countries from the Data Centre of the UNESCO Institute for Statistics were combined with demographic data from the UN Population Division to calculate the share of children of primary school age in each country's population. In total, data for 177 countries were available. All values are for the year 2007.
In Figure 1, the population of primary school age as a percentage of the total population is plotted along the horizontal axis. At the lower end of the scale are Belarus, Bulgaria, Germany, Latvia, Russia, and Ukraine. In these countries, children of primary school age account for less than 4 percent of the total population. The countries with the highest share of children of primary school age are located in Sub-Saharan Africa: Uganda (21 percent), Zambia (20 percent), Lesotho, Mozambique, Somalia (19 percent), Malawi, Swaziland, and Tanzania (18 percent).
The share of children out of school is plotted along the vertical axis. For five countries, the available statistics indicate that less than 0.5 percent of children are out of school: Japan, Malaysia, Spain, Uruguay, and Uzbekistan. In eight countries, half or more of all children are not in school: Somalia (77 percent), Chad (64 percent), Niger (62 percent), Liberia (61 percent), Ethiopia (55 percent), Eritrea (54 percent), Burkina Faso (53 percent), and Haiti (50 percent). Except for Haiti and Pakistan, the 20 countries with the highest share of children out of school are located in Sub-Saharan Africa.
The color of the marker for each country in Figure 1 indicates the geographic region according to the grouping used for the UN Millennium Development Goals (MDG). The size of each marker indicates the absolute size of the population of primary school age. The big red circle is the marker for India and the big green circle is the marker for China. Other countries with a large number of children of primary school age are Indonesia in South-Eastern Asia, USA in the developed countries, and Nigeria in Sub-Saharan Africa.
The distribution of the points in Figure 1 shows that countries with a small share of children of primary school age in the total population also tend to have a small percentage of children out of school. By contrast, countries with a relatively large population of primary school age also have a higher percentage of children out of school. This positive correlation between the two variables is confirmed by a linear regression of the percent of children out of school on the percent of children of primary school age and the squared percent of children of primary school age. The predicted share of children out of school is indicated by the dark gray line. The light gray band around the prediction line indicates the 95 percent confidence interval.
Figure 1: Population of primary school age and children out of school by country, 2007

Note: Marker size indicates the number of children of primary school age in a country.
Data source: UNESCO Institute for Statistics, UNICEF, UN Population Division.
For Figure 2, the data from the 177 countries in Figure 1 were combined by MDG region. The share of children of primary school age in a region's population is plotted along the horizontal axis and the share of children out of school along the vertical axis. The colors of the markers are the same as in Figure 1. The regional values, summarized in Table 1, reflect the 177 countries for which data were available.
Figure 2: Population of primary school age and children out of school by MDG region, 2007

Note: Marker size indicates the number of children of primary school age in a region.
Data source: UNESCO Institute for Statistics, UNICEF, UN Population Division.
At the global level, about 10 percent of the population are of primary school age. The regional values range from 4.6 percent in the Commonwealth of Independent States to 16.5 percent in Sub-Saharan Africa. The average share of children out of school across the 177 countries with data is 15.5 percent. In six regions, fewer than 10 percent of all children are out of school: Commonwealth of Independent States, developed countries, Eastern Asia, Latin America and the Caribbean, Northern Africa, and South-Eastern Asia. Sub-Saharan Africa has by far the highest share of children out of school, with 36.2 percent, followed by Southern Asia with 20 percent and Oceania with 17.1 percent.
Table 1: Population of primary school age and children out of school by MDG region, 2007
Data source: UNESCO Institute for Statistics, UNICEF, UN Population Division.
Due to their current population structure and demographic trends, countries in Sub-Saharan Africa have to provide schools and teachers for a relatively larger number of children than countries in other regions. The Millennium Development Goal of universal primary education by 2015 is therefore more difficult to meet for countries in Sub-Saharan Africa than for countries with a relatively small and constant or shrinking population of primary school age.
Data sources
Permanent URL: http://huebler.blogspot.com/2009/02/coos.html
The link between the population structure and the number of children out of school is shown in the figures and table below. Data on the share of children of primary school age out of school were obtained from the Childinfo website of UNICEF. The official primary school ages in individual countries from the Data Centre of the UNESCO Institute for Statistics were combined with demographic data from the UN Population Division to calculate the share of children of primary school age in each country's population. In total, data for 177 countries were available. All values are for the year 2007.
In Figure 1, the population of primary school age as a percentage of the total population is plotted along the horizontal axis. At the lower end of the scale are Belarus, Bulgaria, Germany, Latvia, Russia, and Ukraine. In these countries, children of primary school age account for less than 4 percent of the total population. The countries with the highest share of children of primary school age are located in Sub-Saharan Africa: Uganda (21 percent), Zambia (20 percent), Lesotho, Mozambique, Somalia (19 percent), Malawi, Swaziland, and Tanzania (18 percent).
The share of children out of school is plotted along the vertical axis. For five countries, the available statistics indicate that less than 0.5 percent of children are out of school: Japan, Malaysia, Spain, Uruguay, and Uzbekistan. In eight countries, half or more of all children are not in school: Somalia (77 percent), Chad (64 percent), Niger (62 percent), Liberia (61 percent), Ethiopia (55 percent), Eritrea (54 percent), Burkina Faso (53 percent), and Haiti (50 percent). Except for Haiti and Pakistan, the 20 countries with the highest share of children out of school are located in Sub-Saharan Africa.
The color of the marker for each country in Figure 1 indicates the geographic region according to the grouping used for the UN Millennium Development Goals (MDG). The size of each marker indicates the absolute size of the population of primary school age. The big red circle is the marker for India and the big green circle is the marker for China. Other countries with a large number of children of primary school age are Indonesia in South-Eastern Asia, USA in the developed countries, and Nigeria in Sub-Saharan Africa.
The distribution of the points in Figure 1 shows that countries with a small share of children of primary school age in the total population also tend to have a small percentage of children out of school. By contrast, countries with a relatively large population of primary school age also have a higher percentage of children out of school. This positive correlation between the two variables is confirmed by a linear regression of the percent of children out of school on the percent of children of primary school age and the squared percent of children of primary school age. The predicted share of children out of school is indicated by the dark gray line. The light gray band around the prediction line indicates the 95 percent confidence interval.
Figure 1: Population of primary school age and children out of school by country, 2007
Note: Marker size indicates the number of children of primary school age in a country.
Data source: UNESCO Institute for Statistics, UNICEF, UN Population Division.
For Figure 2, the data from the 177 countries in Figure 1 were combined by MDG region. The share of children of primary school age in a region's population is plotted along the horizontal axis and the share of children out of school along the vertical axis. The colors of the markers are the same as in Figure 1. The regional values, summarized in Table 1, reflect the 177 countries for which data were available.
Figure 2: Population of primary school age and children out of school by MDG region, 2007
Note: Marker size indicates the number of children of primary school age in a region.
Data source: UNESCO Institute for Statistics, UNICEF, UN Population Division.
At the global level, about 10 percent of the population are of primary school age. The regional values range from 4.6 percent in the Commonwealth of Independent States to 16.5 percent in Sub-Saharan Africa. The average share of children out of school across the 177 countries with data is 15.5 percent. In six regions, fewer than 10 percent of all children are out of school: Commonwealth of Independent States, developed countries, Eastern Asia, Latin America and the Caribbean, Northern Africa, and South-Eastern Asia. Sub-Saharan Africa has by far the highest share of children out of school, with 36.2 percent, followed by Southern Asia with 20 percent and Oceania with 17.1 percent.
Table 1: Population of primary school age and children out of school by MDG region, 2007
| MDG region | Population of primary school age as share of total population (%) | Children of primary school age out of school (%) |
| Developed countries | 6.4 | 4.6 |
| Commonwealth of Independent States | 4.6 | 6.8 |
| Eastern Asia | 7.1 | 0.8 |
| South-Eastern Asia | 10.8 | 6.5 |
| Oceania | 14.5 | 17.1 |
| Southern Asia | 10.8 | 20.0 |
| Western Asia | 12.5 | 12.5 |
| Northern Africa | 11.9 | 5.9 |
| Sub-Saharan Africa | 16.5 | 36.2 |
| Latin America and the Caribbean | 10.3 | 7.2 |
| World | 9.8 | 15.5 |
Due to their current population structure and demographic trends, countries in Sub-Saharan Africa have to provide schools and teachers for a relatively larger number of children than countries in other regions. The Millennium Development Goal of universal primary education by 2015 is therefore more difficult to meet for countries in Sub-Saharan Africa than for countries with a relatively small and constant or shrinking population of primary school age.
Data sources
- Children out of school: UNICEF Childinfo, "Children out of school", January 2009.
- Official primary school age: UNESCO Institute for Statistics, Data Centre, May 2008.
- Population structure: UN Population Division, World Population Prospects: The 2006 Revision, March 2007.
- Regional distribution of children out of school
- Global population of primary school age, 2000-2015
- Universal primary education by 2015: A goal out of reach?
- Official school ages: primary, secondary, and compulsory education
- Millennium Development Goal regions and UNICEF regions
- Official MDG targets and indicators
- UNESCO Institute for Statistics
- UNICEF Childinfo
- UN Population Division
- UN Millennium Development Goals
Permanent URL: http://huebler.blogspot.com/2009/02/coos.html
Sunday, November 16, 2008
Pupil/teacher ratio in secondary school
The pupil/teacher ratio is an indicator of education quality. In crowded classrooms with a high number of pupils per teacher the quality of education suffers. For pupils it is difficult to follow the course and teachers can dedicate less time to the needs of each individual student. Data from UNESCO on the pupil/teacher ratio in primary school show that crowded classrooms are more common in Sub-Saharan Africa and Southern Asia than in other parts of the world. 22 of the 27 countries with 40 or more pupils per primary school teacher are located in Sub-Saharan Africa.
In secondary school, pupil/teacher ratios are lower than in primary school. The Data Centre of the UNESCO Institute for Statistics provides the pupil/teacher ratio in secondary school for 189 countries and territories. For 100 countries, the pupil/teacher ratios are from 2006, 9 countries have data from 2007, 51 countries have data from 2004 or 2005, and the remaining 29 countries have data from 1999 to 2003. For the map below, all countries with data were divided into five groups:

Data source: UNESCO Institute for Statistics, Data Centre, May 2008.
The lowest pupil/teacher ratios in secondary school were reported for Bermuda (6.0), Tokelau (7.0), Portugal (7.1), and Andorra (7.8). 20 additional countries have pupil/teacher ratios above 8 and below 10: Armenia, Azerbaijan, Belarus, British Virgin Islands, Cayman Islands, Croatia, Georgia, Greece, Kuwait, Lebanon, Liechtenstein, Lithuania, Malta, Monaco, Niue, Norway, Qatar, Russia, Sweden, and Turks and Caicos Islands.
More than half of all countries - including most countries in North and South America, Europe, the Middle East, and East Asia - have pupil/teacher ratios between 10 and 19. The group also includes some countries in other regions. Although pupil/teacher ratios in Sub-Saharan Africa are generally higher than in other parts of the world, the following countries from the region have only 10 to 19 pupils per secondary school teacher: Angola, Botswana, Burundi, Cameroon, Cape Verde, Comoros, Democratic Republic of Congo, Ghana, Guinea-Bissau, Mauritius, Seychelles, and Swaziland. 22 of the 41 countries with pupil/teacher ratios between 20 and 29 are also located in Sub-Saharan Africa.
17 countries have 30 or more pupils per teacher in secondary school and 10 of these countries are in Sub-Saharan Africa. The countries with 30 to 39 pupils per teacher are Chad, Congo, Djibouti, Honduras, India, Kenya, Mozambique, Myanmar, Nepal, Nicaragua, Philippines, South Africa, and Zambia. Classes at the secondary level of education are most crowded in Nigeria (pupil/teacher ratio 40.2), Pakistan (41.9), Malawi (45.6), and Eritrea (54.4).
The following table lists the average pupil/teacher ratio in secondary school by Millennium Development Goal region. The Commonwealth of Independent States (10.9), the developed countries (11.4), Oceania (14.8), Western Asia (15.3), Latin America and the Caribbean (16.6), Eastern Asia (19.0), and Northern Africa (19.0) have average pupil/teacher ratios below 20. Pupil/teacher ratios are highest in South-Eastern Asia (22.8), Sub-Saharan Africa (25.8), and Southern Asia (26.4). The global average is 18.0 pupils per teacher in secondary school. These average values are unweighted, which means that each country is given the same weight within its region, regardless of the size of its population.
Average pupil/teacher ratio in secondary school by MDG region, circa 2006
Data source: UNESCO Institute for Statistics, Data Centre, May 2008. Regional and global averages are unweighted.
The data analyzed in this article can be downloaded from the UNESCO Institute for Statistics Data Centre, under Predefined Tables - Education - Table 11: Indicators on teaching staff at ISCED levels 0 to 3.
Related articles
Friedrich Huebler, 16 November 2008, Creative Commons License
Permanent URL: http://huebler.blogspot.com/2008/11/ptr.html
In secondary school, pupil/teacher ratios are lower than in primary school. The Data Centre of the UNESCO Institute for Statistics provides the pupil/teacher ratio in secondary school for 189 countries and territories. For 100 countries, the pupil/teacher ratios are from 2006, 9 countries have data from 2007, 51 countries have data from 2004 or 2005, and the remaining 29 countries have data from 1999 to 2003. For the map below, all countries with data were divided into five groups:
- Fewer than 10 pupils per teacher: 24 countries
- 10 to 19 pupils per teacher: 107 countries
- 20 to 29 pupils per teacher: 41 countries
- 30 to 39 pupils per teacher: 13 countries
- 40 or more pupils per teacher: 4 countries
Data source: UNESCO Institute for Statistics, Data Centre, May 2008.
The lowest pupil/teacher ratios in secondary school were reported for Bermuda (6.0), Tokelau (7.0), Portugal (7.1), and Andorra (7.8). 20 additional countries have pupil/teacher ratios above 8 and below 10: Armenia, Azerbaijan, Belarus, British Virgin Islands, Cayman Islands, Croatia, Georgia, Greece, Kuwait, Lebanon, Liechtenstein, Lithuania, Malta, Monaco, Niue, Norway, Qatar, Russia, Sweden, and Turks and Caicos Islands.
More than half of all countries - including most countries in North and South America, Europe, the Middle East, and East Asia - have pupil/teacher ratios between 10 and 19. The group also includes some countries in other regions. Although pupil/teacher ratios in Sub-Saharan Africa are generally higher than in other parts of the world, the following countries from the region have only 10 to 19 pupils per secondary school teacher: Angola, Botswana, Burundi, Cameroon, Cape Verde, Comoros, Democratic Republic of Congo, Ghana, Guinea-Bissau, Mauritius, Seychelles, and Swaziland. 22 of the 41 countries with pupil/teacher ratios between 20 and 29 are also located in Sub-Saharan Africa.
17 countries have 30 or more pupils per teacher in secondary school and 10 of these countries are in Sub-Saharan Africa. The countries with 30 to 39 pupils per teacher are Chad, Congo, Djibouti, Honduras, India, Kenya, Mozambique, Myanmar, Nepal, Nicaragua, Philippines, South Africa, and Zambia. Classes at the secondary level of education are most crowded in Nigeria (pupil/teacher ratio 40.2), Pakistan (41.9), Malawi (45.6), and Eritrea (54.4).
The following table lists the average pupil/teacher ratio in secondary school by Millennium Development Goal region. The Commonwealth of Independent States (10.9), the developed countries (11.4), Oceania (14.8), Western Asia (15.3), Latin America and the Caribbean (16.6), Eastern Asia (19.0), and Northern Africa (19.0) have average pupil/teacher ratios below 20. Pupil/teacher ratios are highest in South-Eastern Asia (22.8), Sub-Saharan Africa (25.8), and Southern Asia (26.4). The global average is 18.0 pupils per teacher in secondary school. These average values are unweighted, which means that each country is given the same weight within its region, regardless of the size of its population.
Average pupil/teacher ratio in secondary school by MDG region, circa 2006
| MDG region | Pupil/teacher ratio |
| Developed countries | 11.4 |
| Commonwealth of Independent States | 10.9 |
| Eastern Asia | 19.0 |
| South-Eastern Asia | 22.8 |
| Oceania | 14.8 |
| Southern Asia | 26.4 |
| Western Asia | 15.3 |
| Northern Africa | 19.0 |
| Sub-Saharan Africa | 25.8 |
| Latin America and the Caribbean | 16.6 |
| World | 18.0 |
The data analyzed in this article can be downloaded from the UNESCO Institute for Statistics Data Centre, under Predefined Tables - Education - Table 11: Indicators on teaching staff at ISCED levels 0 to 3.
Related articles
- Pupil/teacher ratio in primary school
- UNESCO releases data from 2007 education survey
- Millennium Development Goal regions and UNICEF regions
Friedrich Huebler, 16 November 2008, Creative Commons License
Permanent URL: http://huebler.blogspot.com/2008/11/ptr.html
Sunday, October 26, 2008
Pupil/teacher ratio in primary school
Global primary school attendance rates have been on a steady upward trend over the past years. As the world moves closer to the goal of universal primary education, the issue of education quality attracts increasing attention. One measure of education quality is the pupil/teacher ratio, the number of pupils per teacher in a school. Teachers of a large class can dedicate less time to each pupil than in a small class. For the pupils, crowded classrooms make it difficult to concentrate on the material and to learn. The results of overcrowding are lower academic achievement and increased dropout rates.
The map below displays the pupil/teacher ratio in primary school in 194 countries and territories for which data were available. The data were obtained from the UNESCO Institute for Statistics. For 124 countries, the pupil/teacher ratios are from 2006, 12 countries have data from 2007, 42 countries have data from 2004 or 2005, and the remaining 16 countries have data from 1999 to 2003. For the map, all countries were divided into five groups:
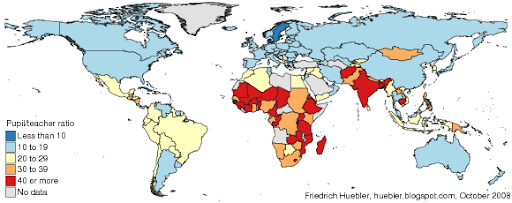
Data source: UNESCO Institute for Statistics, Data Centre, May 2008.
The lowest pupil/teacher ratios in primary school were observed in Tokelau (5.8), San Marino (6.3), Bermuda (8.3), Liechtenstein (8.4), Denmark (9.9), and Sweden and Cuba (10.0). Most developed countries, countries in Eastern Europe and former members states of the Soviet Union have pupil/teacher ratios between 10 and 19. Some countries in East and South-East Asia, the Middle East, Africa, and Latin America also belong to this group, among them China, the world's most populous country, with a pupil/teacher ratio of 18.3. The majority of countries in Latin America, as well as some countries in Africa and Asia, have pupil/teacher ratios between 20 and 29.
Pupil/teacher ratios above 30 are common in Sub-Saharan Africa and South Asia. In 11 countries, primary school teachers have more than 50 pupils on average: Afghanistan (83.4), Mozambique (67.4), Rwanda (65.9), Chad (63.2), Mali (55.6), Congo (54.8), Burundi (54.2), Tanzania (53.1), Zambia (51.2), Bangladesh (50.9), and Cambodia (50.4). 22 of the 27 countries with 40 or more pupils per teacher are located in Sub-Saharan Africa.
The following table lists the average pupil/teacher ratio in primary school by Millennium Development Goal region. The highest pupil/teacher ratios exist in Sub-Saharan Africa (40.7) and Southern Asia (37.8). In contrast, the average pupil/teacher ratio in the developed countries is 13.7. In Western Asia (17.8), the Commonwealth of Independent States (17.9), and Oceania (19.8), the average pupil/teacher ratio is also below 20. The global average is 24.6 pupils per teacher in primary school. All regional and global averages are not weighted the population of each country; instead, each country is given the same weight within its region, regardless of the size of its population.
Pupil/teacher ratio in primary school by MDG region, circa 2006
Data source: UNESCO Institute for Statistics, Data Centre, May 2008. Regional and global averages are unweighted.
The data analyzed in this article can be downloaded from the UNESCO Institute for Statistics Data Centre, under Predefined Tables - Education - Table 11: Indicators on teaching staff at ISCED levels 0 to 3.
Related articles
Permanent URL: http://huebler.blogspot.com/2008/10/ptr.html
The map below displays the pupil/teacher ratio in primary school in 194 countries and territories for which data were available. The data were obtained from the UNESCO Institute for Statistics. For 124 countries, the pupil/teacher ratios are from 2006, 12 countries have data from 2007, 42 countries have data from 2004 or 2005, and the remaining 16 countries have data from 1999 to 2003. For the map, all countries were divided into five groups:
- Fewer than 10 pupils per teacher: 7 countries
- 10 to 19 pupils per teacher: 90 countries
- 20 to 29 pupils per teacher: 43 countries
- 30 to 39 pupils per teacher: 27 countries
- 40 or more pupils per teacher: 27 countries
Data source: UNESCO Institute for Statistics, Data Centre, May 2008.
The lowest pupil/teacher ratios in primary school were observed in Tokelau (5.8), San Marino (6.3), Bermuda (8.3), Liechtenstein (8.4), Denmark (9.9), and Sweden and Cuba (10.0). Most developed countries, countries in Eastern Europe and former members states of the Soviet Union have pupil/teacher ratios between 10 and 19. Some countries in East and South-East Asia, the Middle East, Africa, and Latin America also belong to this group, among them China, the world's most populous country, with a pupil/teacher ratio of 18.3. The majority of countries in Latin America, as well as some countries in Africa and Asia, have pupil/teacher ratios between 20 and 29.
Pupil/teacher ratios above 30 are common in Sub-Saharan Africa and South Asia. In 11 countries, primary school teachers have more than 50 pupils on average: Afghanistan (83.4), Mozambique (67.4), Rwanda (65.9), Chad (63.2), Mali (55.6), Congo (54.8), Burundi (54.2), Tanzania (53.1), Zambia (51.2), Bangladesh (50.9), and Cambodia (50.4). 22 of the 27 countries with 40 or more pupils per teacher are located in Sub-Saharan Africa.
The following table lists the average pupil/teacher ratio in primary school by Millennium Development Goal region. The highest pupil/teacher ratios exist in Sub-Saharan Africa (40.7) and Southern Asia (37.8). In contrast, the average pupil/teacher ratio in the developed countries is 13.7. In Western Asia (17.8), the Commonwealth of Independent States (17.9), and Oceania (19.8), the average pupil/teacher ratio is also below 20. The global average is 24.6 pupils per teacher in primary school. All regional and global averages are not weighted the population of each country; instead, each country is given the same weight within its region, regardless of the size of its population.
Pupil/teacher ratio in primary school by MDG region, circa 2006
| MDG region | Pupil/teacher ratio |
| Developed countries | 13.7 |
| Commonwealth of Independent States | 17.9 |
| Eastern Asia | 23.4 |
| South-Eastern Asia | 26.5 |
| Oceania | 19.8 |
| Southern Asia | 37.8 |
| Western Asia | 17.8 |
| Northern Africa | 24.4 |
| Sub-Saharan Africa | 40.7 |
| Latin America and the Caribbean | 21.3 |
| World | 24.6 |
The data analyzed in this article can be downloaded from the UNESCO Institute for Statistics Data Centre, under Predefined Tables - Education - Table 11: Indicators on teaching staff at ISCED levels 0 to 3.
Related articles
- Pupil/teacher ratio in secondary school
- A view inside primary schools
- UNESCO releases data from 2007 education survey
- Universal primary education by 2015: A goal out of reach?
- Millennium Development Goal regions and UNICEF regions
- Millennium Development Goal 2: Universal primary education
- UNESCO Institute for Statistics Data Centre
Permanent URL: http://huebler.blogspot.com/2008/10/ptr.html
Subscribe to:
Posts (Atom)