Showing posts with label UNICEF. Show all posts

Wednesday, December 30, 2009

MICS Compiler by UNICEF

MICS Compiler, a new website by UNICEF, provides easy access to data from Multiple Indicator Cluster Surveys (MICS), nationally representative household surveys that are carried out with support from UNICEF. The site is similar to STATcompiler, which offers data from Demographic and Health Surveys (DHS).

MICS Compiler was launched with data from 26 surveys conducted in Africa, Asia, Eastern Europe, and Latin America and the Caribbean between 2005 and 2007. Estimates are available for 39 indicators in ten areas.
  1. Survey information
  2. Child mortality
  3. Nutrition
  4. Child health
  5. Environment
  6. Reproductive health
  7. Child development
  8. Education
  9. Child protection
  10. HIV/AIDS, sexual behavior, and orphaned and vulnerable children
Access to the data requires two steps. In the first step, users of MICS Compiler must select one or more surveys. In the second step, the indicators are selected. The results are presented in tables or graphs. As an example, the screenshot below shows a graph with the female youth literacy rate in 21 countries.

MICS Compiler by UNICEF: Female youth literacy rate in 21 countries, 2005-2006
MICS Compiler screenshot with female youth literacy rate

At present, the female youth literacy rate is the only indicator listed in the area of education but the MICS for All blog has announced plans to expand MICS Compiler with data for more indicators and more surveys. There are also plans for adding a mapping function, similar to the DHS STATmapper.

Related articles
External links
Friedrich Huebler, 30 December 2009, Creative Commons License
Permanent URL: http://huebler.blogspot.com/2009/12/mics.html

Sunday, March 15, 2009

Disparities in secondary school attendance by ethnicity, language or religion

Members of ethnic, linguistic or religious minorities face barriers to access to education in many countries. In an article on primary school attendance by ethnicity, language or religion the presence of such disparities was demonstrated with data from Multiple Indicator Cluster Surveys. The MICS are nationally representative household surveys supported by UNICEF that collect data on school attendance and other household member characteristics. In the most recent round of MICS surveys, carried out in 2005 and 2006, 17 countries collected data on school attendance by ethnicity, language or religion: Albania, Belize, Gambia, Georgia, Guinea-Bissau, Guyana, Kazakhstan, Kyrgyzstan, Lao PDR, Macedonia, Montenegro, Serbia, Sierra Leone, Thailand, Togo, Uzbekistan, and Viet Nam.

The school attendance data from the MICS surveys can be used to generate an education parity index that measures relative disparity across different groups of disaggregation, as described in the article on primary school attendance. To calculate the index, the attendance rate of the group with the lowest value is divided by the attendance rate of the group with the highest value. The result is a value between 0 and 1, where 1 means that children from different ethnic, linguistic or religious groups have the same secondary school attendance rate. Values closer to 0 indicate increasing disparity.

As an example, Thailand collected data on school attendance that can be linked to the mother tongue of the household head. The secondary school net attendance rates (NAR) for two groups of children identified in the 2005-06 MICS data are shown in Table 1.

Table 1: Secondary school attendance in Thailand
Mother tongue of household head
Secondary NAR (%)
Thai 81.2
Other language 65.8
Total 79.8
Data source: MICS 2005-06.

Among children from households whose head speaks Thai, the secondary NAR is 81.2 percent. Among children from households headed by someone with a different mother tongue, the secondary NAR is 65.8 percent. The secondary school parity index for Thailand is then calculated as follows.

Secondary school parity index = Lowest secondary NAR / Highest secondary NAR

= Secondary NAR of speakers of another language /
   Secondary NAR of speakers of Thai

= 65.8 / 81.2

= 0.81

The parity index is a relative, not an absolute measure of disparity. The value 0.81 means that the secondary NAR of speakers of another language is, relatively speaking, 19 percent below the secondary NAR of Thai speakers. The absolute gap between children from the two groups is 15.4 percent, the difference between 81.2 and 65.8.

The secondary school parity index for all 17 countries with data is shown in Figure 1. The index ranges from a high of 0.98 in Viet Nam to a low of 0.17 in Serbia. The low value for Serbia is explained by extremely low secondary school attendance among the Roma ethnic group. The secondary school NAR for Roma children is 14.8 percent, compared to 85.9 percent for Serbians and 88.6 percent for children from other ethnic groups. In addition to Serbia, six other countries have index values at or below 0.5: Lao PDR, Macedonia, Guinea-Bissau, Togo, Belize, and Montenegro. In these countries, children from the most advantaged ethnic, linguistic or religious group have secondary school net attendance rates that are at least twice as high as the attendance rates of children from the most disadvantaged group. In Viet Nam, Kazakhstan, Albania, and Uzbekistan, on the other hand, disparities in access to secondary education are relatively small.

Figure 1: Secondary school parity index: School attendance by ethnicity, language or religion
Bar graph showing secondary school parity index in 17 countries
Data source: MICS 2005-2006.

The attendance rates used to calculate the secondary school parity index are summarized in Table 2. The table also shows whether the national agencies that implemented a survey chose ethnicity, language or religion to identify minorities. A comparison with data on primary school attendance makes clear that disparities at the secondary level of education are much larger than disparities at the primary level, where the parity index for the same group of countries has a range from 0.59 to 0.99.

Table 2: Disparities in secondary school attendance by ethnicity, language or religion
Country Year Characteristic Primary NAR (%) Parity index
Min. Max.
Albania 2005 Religion 77.1 83.7 0.92
Belize 2006 Language 36.9 79.2 0.47
Gambia 2006 Ethnicity 27.5
48.2 0.57
Georgia 2005 Ethnicity 69.0
90.6 0.76
Guinea-Bissau 2006 Language 4.3
13.8 0.31
Guyana 2006 Ethnicity 56.0
81.1 0.69
Kazakhstan 2006 Language 90.8
96.0 0.95
Kyrgyzstan 2006 Language 79.3
92.4 0.86
Lao PDR 2006 Language 10.0
45.6 0.22
Macedonia 2005 Ethnicity 17.4
73.7 0.24
Montenegro 2005 Ethnicity 46.5
92.9 0.50
Serbia 2005 Ethnicity 14.8 88.6 0.17
Sierra Leone 2005 Religion 17.8 24.4 0.73
Thailand 2005-06 Language 65.8
81.2 0.81
Togo 2006 Ethnicity 22.9
53.1 0.43
Uzbekistan 2006 Language 87.1
95.4 0.91
Viet Nam
2006 Ethnicity 93.8
95.7 0.98
Data source: MICS 2005-2006.

Data source
Related articles
External links
Friedrich Huebler, 15 March 2009, Creative Commons License
Permanent URL: http://huebler.blogspot.com/2009/03/elr2.html

Sunday, March 1, 2009

Disparities in primary school attendance by ethnicity, language or religion

In many parts of the world, members of ethnic, linguistic or religious minorities face barriers to access to education. One example is Nepal, where caste and ethnicity are closely linked to primary and secondary school attendance rates. Because of the importance of this issue, "Minorities and the right to education" was the thematic focus of the first United Nations Forum on Minority Issues, which took place in Geneva on 15 and 16 December 2008.

The presence of disparities in national education systems can be demonstrated with data from Multiple Indicator Cluster Surveys (MICS), nationally representative household surveys that are carried out with the support of UNICEF. The MICS data collection process is explained in the Multiple Indicator Cluster Survey Manual 2005 (UNICEF 2006). MICS surveys conducted in 2005 and 2006 collected data on school attendance by ethnicity, language or religion in the following countries: Albania, Belize, Gambia, Georgia, Guinea-Bissau, Guyana, Kazakhstan, Kyrgyzstan, Lao PDR, Macedonia, Montenegro, Serbia, Sierra Leone, Thailand, Togo, Uzbekistan, and Viet Nam.

Minority Rights Group International (MRG) defines minorities as "non-dominant ethnic, religious and linguistic communities, who may not necessarily be numerical minorities. ... [These groups] may lack access to political power, face discrimination and human rights abuses, and have 'development' policies imposed upon them" (MRG 2009). The MICS data alone are not sufficient to identify groups that can be considered minorities as defined by MRG because the size of particular groups in relation to the entire population of a country does not indicate whether these groups are discriminated in any way. This article therefore examines differences in school attendance between all ethnic, linguistic or religious groups for which data are available. Disparities between these groups can provide insights into whether any part of a country's population faces discrimination or is otherwise disadvantaged.

With the school attendance data from the MICS surveys it is possible to generate an education parity index that measures relative disparity across different groups of disaggregation, following the methodology developed by Huebler (2008) for data on school attendance by sex, area of residence, and household wealth. The education parity index has a range of 0 to 1, where 1 indicates parity between all groups of disaggregation. This methodology can also be applied to primary school attendance rates by ethnicity, language or religion. To calculate the index, the attendance rate of the group with the lowest value is divided by the attendance rate of the group with the highest value, yielding a value between 0 and 1. The value 1 means that children from different ethnic, linguistic or religious groups have the same primary school attendance rates. Smaller values indicate increasing disparity.

The calculation of the parity index can be illustrated with data from Macedonia. A MICS survey conducted in 2005 collected data on school attendance by ethnic group of the household head. Four ethnic groups are identified in the data and their respective primary school net attendance rates (NAR) are shown in Table 1.

Table 1: Primary school attendance in Macedonia
Ethnic group of household head
Primary NAR (%)
Albanian 97.8
Macedonian 97.5
Roma 61.1
Other ethnic group 81.9
Total 94.9
Data source: MICS 2005.

Albanians in Macedonia have the highest primary NAR, 97.8 percent. By contrast, Roma have the lowest NAR, 61.1 percent. In other words, only 6 of 10 Roma children of primary school age are attending primary school. With these values, the primary school parity index for Macedonia can be calculated as follows:

Primary school parity index = Lowest primary NAR / Highest primary NAR

= Primary NAR of Roma / Primary NAR of Albanians

= 61.1 / 97.8

= 0.62

The value 0.62 means that the attendance rate of the most disadvantaged group, Roma, is 62 percent of the attendance rate of the least disadvantaged group, Albanians. In other words, the primary NAR of Roma is 38 percent below the primary NAR of ethnic Albanians. 38 percent is not the absolute but the relative difference in school attendance because the education parity index is a relative measure of disparity.

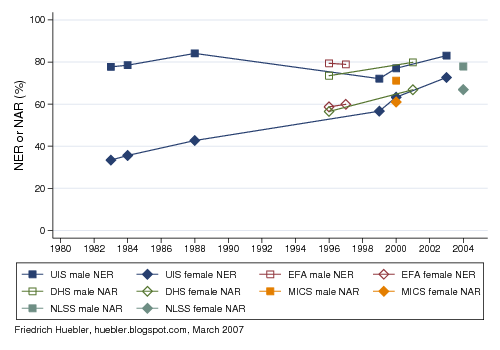
Applying the same formula to primary NAR values from other MICS surveys yields the values in Figure 1, which shows the parity index for primary school attendance by ethnicity, language or religion. In the 17 countries with data, the parity index ranges from a high of 0.99 in Guyana to a low of 0.59 in the Lao People's Democratic Republic. In Laos, speakers of the Lao language are significantly more likely to attend primary school than speakers of other languages, whose primary school NAR is 41 percent below the NAR of Lao speakers. Similar disparities exist in Togo, where members of the Para-Gourma ethnic group have a much lower primary school attendance rate than members of the Akposso-Akébou group, and in Macedonia.

Uzbekistan and Viet Nam are characterized by the near absence of disparities in primary school attendance between different ethnic, linguistic or religious groups, similar to Guyana. In these countries, the primary NAR of the group with the lowest attendance rate is only 1 or 2 percent below the primary NAR of the group with the highest attendance rate.

Figure 1: Primary school parity index: School attendance by ethnicity, language or religion
Bar graph showing primary school parity index in 17 countries
Data source: MICS 2005-2006.

The primary school net attendance rates used to calculate the parity index are listed in Table 2. The table also shows whether ethnicity, language or religion were chosen to identify minorities in a country. This choice was made by the national agencies that implemented the survey. Eight countries selected ethnicity, seven countries selected language, and two countries selected religion as the characteristic that best captures minority status.

Table 2: Disparities in primary school attendance by ethnicity, language or religion
Country Year Characteristic Primary NAR (%) Parity index
Min. Max.
Albania 2005 Religion 91.3 94.9 0.96
Belize 2006 Language 86.6 100 0.87
Gambia 2006 Ethnicity 53.2 72.9 0.73
Georgia 2005 Ethnicity 86.9 97.5 0.89
Guinea-Bissau 2006 Language 44.9 64.7 0.69
Guyana 2006 Ethnicity 95.7 96.8 0.99
Kazakhstan 2006 Language 95.4 98.9 0.96
Kyrgyzstan 2006 Language 86.7 95.4 0.91
Lao PDR 2006 Language 52.4 88.7 0.59
Macedonia 2005 Ethnicity 61.1 97.8 0.62
Montenegro 2005 Ethnicity 69.4 100 0.69
Serbia 2005 Ethnicity 77.9 100 0.78
Sierra Leone 2005 Religion 68.3 72.3 0.94
Thailand 2005-06 Language 94.8 98.2 0.97
Togo 2006 Ethnicity 55.2 91.1 0.61
Uzbekistan 2006 Language 94.9 96.8 0.98
Viet Nam
2006 Ethnicity 93.8 95.7 0.98
Data source: MICS 2005-2006.

References
  • Huebler, Friedrich. 2008. Beyond gender: Measuring disparity in South Asia using an education parity index. Kathmandu: UNICEF.
  • Minority Rights Group International (MRG). 2009. Who are minorities?
  • United Nations Children's Fund (UNICEF). 2006. Multiple Indicator Cluster Survey manual 2005: Monitoring the situation of women and children. New York: UNICEF.
Data source
Related articles
External links
Friedrich Huebler, 1 March 2009 (edited 15 March 2009), Creative Commons License
Permanent URL: http://huebler.blogspot.com/2009/03/elr.html

Sunday, February 8, 2009

Population structure and children out of school

Sub-Saharan Africa is the region with the highest percentage of children out of school. At the same time, the population of most countries in Sub-Saharan Africa is increasing and children of primary school age constitute a large and growing share of the population.

The link between the population structure and the number of children out of school is shown in the figures and table below. Data on the share of children of primary school age out of school were obtained from the Childinfo website of UNICEF. The official primary school ages in individual countries from the Data Centre of the UNESCO Institute for Statistics were combined with demographic data from the UN Population Division to calculate the share of children of primary school age in each country's population. In total, data for 177 countries were available. All values are for the year 2007.

In Figure 1, the population of primary school age as a percentage of the total population is plotted along the horizontal axis. At the lower end of the scale are Belarus, Bulgaria, Germany, Latvia, Russia, and Ukraine. In these countries, children of primary school age account for less than 4 percent of the total population. The countries with the highest share of children of primary school age are located in Sub-Saharan Africa: Uganda (21 percent), Zambia (20 percent), Lesotho, Mozambique, Somalia (19 percent), Malawi, Swaziland, and Tanzania (18 percent).

The share of children out of school is plotted along the vertical axis. For five countries, the available statistics indicate that less than 0.5 percent of children are out of school: Japan, Malaysia, Spain, Uruguay, and Uzbekistan. In eight countries, half or more of all children are not in school: Somalia (77 percent), Chad (64 percent), Niger (62 percent), Liberia (61 percent), Ethiopia (55 percent), Eritrea (54 percent), Burkina Faso (53 percent), and Haiti (50 percent). Except for Haiti and Pakistan, the 20 countries with the highest share of children out of school are located in Sub-Saharan Africa.

The color of the marker for each country in Figure 1 indicates the geographic region according to the grouping used for the UN Millennium Development Goals (MDG). The size of each marker indicates the absolute size of the population of primary school age. The big red circle is the marker for India and the big green circle is the marker for China. Other countries with a large number of children of primary school age are Indonesia in South-Eastern Asia, USA in the developed countries, and Nigeria in Sub-Saharan Africa.

The distribution of the points in Figure 1 shows that countries with a small share of children of primary school age in the total population also tend to have a small percentage of children out of school. By contrast, countries with a relatively large population of primary school age also have a higher percentage of children out of school. This positive correlation between the two variables is confirmed by a linear regression of the percent of children out of school on the percent of children of primary school age and the squared percent of children of primary school age. The predicted share of children out of school is indicated by the dark gray line. The light gray band around the prediction line indicates the 95 percent confidence interval.

Figure 1: Population of primary school age and children out of school by country, 2007
Scatter plot with country data on the share of children of primary school age and the share of children out of school in 2007
Note: Marker size indicates the number of children of primary school age in a country.
Data source: UNESCO Institute for Statistics, UNICEF, UN Population Division.

For Figure 2, the data from the 177 countries in Figure 1 were combined by MDG region. The share of children of primary school age in a region's population is plotted along the horizontal axis and the share of children out of school along the vertical axis. The colors of the markers are the same as in Figure 1. The regional values, summarized in Table 1, reflect the 177 countries for which data were available.

Figure 2: Population of primary school age and children out of school by MDG region, 2007
Scatter plot with regional data on the share of children of primary school age and the share of children out of school in 2007
Note: Marker size indicates the number of children of primary school age in a region.
Data source: UNESCO Institute for Statistics, UNICEF, UN Population Division.

At the global level, about 10 percent of the population are of primary school age. The regional values range from 4.6 percent in the Commonwealth of Independent States to 16.5 percent in Sub-Saharan Africa. The average share of children out of school across the 177 countries with data is 15.5 percent. In six regions, fewer than 10 percent of all children are out of school: Commonwealth of Independent States, developed countries, Eastern Asia, Latin America and the Caribbean, Northern Africa, and South-Eastern Asia. Sub-Saharan Africa has by far the highest share of children out of school, with 36.2 percent, followed by Southern Asia with 20 percent and Oceania with 17.1 percent.

Table 1: Population of primary school age and children out of school by MDG region, 2007
MDG region
Population of primary school age as share of total population (%) Children of primary school age out of school (%)
Developed countries 6.4 4.6
Commonwealth of Independent States 4.6
6.8
Eastern Asia 7.1
0.8
South-Eastern Asia 10.8
6.5
Oceania 14.5
17.1
Southern Asia 10.8
20.0
Western Asia 12.5 12.5
Northern Africa 11.9
5.9
Sub-Saharan Africa 16.5
36.2
Latin America and the Caribbean 10.3 7.2
World 9.8 15.5
Data source: UNESCO Institute for Statistics, UNICEF, UN Population Division.

Due to their current population structure and demographic trends, countries in Sub-Saharan Africa have to provide schools and teachers for a relatively larger number of children than countries in other regions. The Millennium Development Goal of universal primary education by 2015 is therefore more difficult to meet for countries in Sub-Saharan Africa than for countries with a relatively small and constant or shrinking population of primary school age.

Data sources
Related articles
External links
Friedrich Huebler, 8 February 2009 (edited 9 February 2009), Creative Commons License
Permanent URL: http://huebler.blogspot.com/2009/02/coos.html

Sunday, February 1, 2009

The State of the World's Children 2009

Cover of "The State of the World's Children 2009"The 2009 edition of The State of the World's Children was released by UNICEF in January. The main theme of this year's report is maternal and newborn health. Women in developing countries are at a much higher risk of dying from complications during pregnancy or delivery than women in developed countries. For example, the lifetime risk of maternal death is 1 in 7 in Niger and 1 in 17400 in Sweden.

The statistical annex to The State of the World's Children contains tables with national, regional and global data on nutrition, health, HIV and AIDS, education, demography, economy, women, and child protection. In the area of education, the annex lists data for the following indicators:
  • Primary school enrollment and attendance rate
  • Secondary school enrollment and attendance rate
  • Survival rate to the last grade of primary school
  • Youth and adult literacy rate
The survival rate to the last grade of primary school replaced the survival rate to grade 5 that was reported in previous years. This change was made to match the official list of Millennium Development Goal indicators, in which the survival rate to grade 5 was replaced by the survival rate to the last grade as a new indicator for MDG 2, universal primary education by 2015.

The publication of The State of the World's Children was accompanied by an update of UNICEF's Childinfo website, where additional data and analysis can be found. For example, the education section of the Childinfo site lists new national estimates for the number of children out of school, among other statistics.

External links
Related articles
Friedrich Huebler, 1 February 2009, Creative Commons License
Permanent URL: http://huebler.blogspot.com/2009/02/sowc.html

Sunday, November 23, 2008

Multiple Indicator Cluster Survey blog

Screenshot of the "MICS For All" blogThe Multiple Indicator Cluster Surveys (MICS) are household surveys carried out in developing countries with the support of UNICEF to collect data on the situation of children and women. The most recent round of MICS surveys was conducted between 2005 and 2007 in more than 40 countries. MICS data and documentation are available at the Childinfo website of UNICEF.

MICS surveys are among the sources of data analyzed on this site. MICS data were used in articles on trends in primary education in Nepal, children out of school in India, child labor and school attendance in Bolivia, education disparity trends in South Asia, global data on child labor and school attendance, household wealth and years of education, the link between years of schooling and literacy, and other studies.

UNICEF staff members working on the MICS have launched a new blog at globalmics.blogspot.com. The goal of the blog is "to facilitate information sharing between different organizations and individuals involved with MICS implementation around the world" and "to play the role of an unofficial, informal forum to share information on MICS activities." Articles posted since the launch have treated a variety of topics, among them acronyms and abbreviations related to MICS, members of the global MICS team, and the evaluation of the latest round of MICS.

External links
Related articles
Friedrich Huebler, 23 November 2008, Creative Commons License
Permanent URL: http://huebler.blogspot.com/2008/11/mics.html

Sunday, October 12, 2008

Education disparity in South Asia

Cover of "Beyond gender: Measuring disparity in South Asia using an education parity index" by Friedrich HueblerA new publication by Friedrich Huebler describes education disparity in the countries of South Asia. The report Beyond gender: Measuring disparity in South Asia using an education parity index was published by the UNICEF regional office for South Asia in its series of papers on girls' education.

Analysis of disparities in national education systems is often limited to gender although other dimensions of disparity are also important. The publication presents data on disparity in primary and secondary education by gender, area of residence and household wealth for countries in South Asia.

To facilitate the interpretation of complex data a newly developed Education Parity Index is introduced. The EPI combines information on disparities across different education indicators and across different groups of disaggregation. This distinguishes the EPI from existing indicators of disparity in education, including the gender parity index and the EFA development index. The EPI is flexible and can be modified according to national priorities, for example by including information on disparities between different ethnic groups.

The use of the EPI as a tool to assess education disparities is illustrated with household survey data from Afghanistan, Bangladesh, India, Nepal and Pakistan. For each country, the report describes how the EPI is calculated. In addition, national trends in education disparity from 1996 to 2006 are presented.

References
  • Huebler, Friedrich. 2008. Beyond gender: Measuring disparity in South Asia using an education parity index. Kathmandu: UNICEF. (Download PDF document, 194 KB)
External links
Related articles
Friedrich Huebler, 12 October 2008 (edited 30 January 2009), Creative Commons License
Permanent URL: http://huebler.blogspot.com/2008/10/epi.html

Sunday, September 7, 2008

Child labor: economic activity and household chores

Child labor is one of the obstacles on the way to the Millennium Development Goal of universal primary education by 2015. In a report on global child labor trends, the International Labour Organization (ILO) estimates that there are 218 million child laborers worldwide. 126 million of these children are estimated to be engaged in hazardous work (ILO 2006). The concept of child labor used by the ILO is derived from two conventions: ILO Convention 138, which sets 15 years as the general minimum age for employment, and ILO Convention 182 on the worst forms of child labor. Any work in violation of Conventions 138 and 182 is considered illegal child labor that should be eliminated.

One limitation of statistics like those published by the ILO is that they only refer to economic activity, that is work related to the production of goods and services, as defined in the United Nations System of National Accounts (UNSD 2001). This definition excludes chores undertaken in a person's own household like cooking, cleaning or caring for children.

Statistics of child labor that ignore household chores are problematic because they underestimate the burden of work on children, especially for girls. To examine the relative burden of economic activities and household chores carried out by children, data from 35 household surveys were analyzed for this article. Grouped by Millennium Development Region, these surveys are:
  • Developed countries: Albania.
  • Eastern Asia: Mongolia.
  • South-eastern Asia: Lao PDR, Philippines.
  • Southern Asia: India.
  • Western Asia: Bahrain, Lebanon, Palestinians in Syria.
  • Sub-Saharan Africa: Angola, Burundi, Central African Republic, Chad, Comoros, Congo, Côte d'Ivoire, Democratic Republic of the Congo, Gambia, Guinea, Guinea-Bissau, Kenya, Lesotho, Malawi, Mali, Niger, Senegal, Sierra Leone, Somalia, Swaziland, Tanzania, Uganda.
  • Latin America and the Caribbean: Bolivia, Colombia, Dominican Republic, Nicaragua, Trinidad and Tobago.
The surveys were conducted between 1999 and 2005. 26 of the surveys were Multiple Indicator Cluster Surveys (MICS) and 9 were Demographic and Health Surveys (DHS). All 35 surveys collected data on work by children in the week preceding the survey. Surveys conducted during school vacation were excluded because the focus of the present analysis is work by children that should have been in school at the time of the survey.

The share of children aged 7 to 14 years in economic activity and household chores is depicted in the following graph. The graph also displays the number of hours spent per week on both types of work. All numbers are averages across the 35 surveys, weighted by each country's population between 7 and 14 years.

Economic activity and household chores, children 7-14 years
Graph showing the link between household wealth and average years of education
Data source: 35 DHS and MICS surveys, 1999-2005.

The results confirm that boys are more likely to be engaged in economic activity while girls are more likely to do household chores. On average across the 35 surveys, 22 percent of all boys and 19 percent of all girls between 7 and 14 years are engaged in economic activity. Boys also spend more hours on economic activity than girls, 20 compared to 19 hours. By comparison, girls are much more likely than boys to do household chores. 70 percent of all girls and 47 percent of all boys did household chores in the week preceding the survey. On average, girls spent 13 hours and boys 10 hours per week on household chores.

What are the implications of these findings for statistics of child labor, as currently defined by the ILO? Take the case of two families that need additional income to provide food for everyone in the household. In the first family, a 10-year-old boy is withdrawn from school and put to work on a farm. Because such work is considered economic activity the number of child laborers goes up. In the second family, the mother decides to start working on a farm and her 10-year-old daughter is asked to stay at home to care for her younger siblings. Because the girl is engaged in household chores the number of child laborers does not change. The consequences are the same for both children: they no longer go to school and miss out on the benefits from education.

To address the limitations of the ILO's definition of child labor, UNICEF has developed an expanded definition that covers household chores in addition to economic activity. This revised indicator is the basis for the child labor estimates that are reported in publications like Progress for Children (UNICEF 2007a) or The State of the World’s Children (UNICEF 2007b). For children 5 to 17 years of age, UNICEF defines child labor as follows:
  • 5 to 11 years: any economic activity, or 28 hours or more household chores per week;
  • 12 to 14 years: any economic activity (except light work for less than 14 hours per week), or 28 hours or more household chores per week;
  • 15 to 17 years: any hazardous work, including any work for 43 hours or more per week.
The goal of UNICEF's child labor indicator is the measurement of work that should be eliminated because it violates international child labor conventions and interferes with school attendance. The threshold for household chores is set relatively high because it is assumed that household chores are less harmful than economic activity. Moreover, the high threshold of 28 hours household chores per week avoids a possible overestimation of the number of child laborers.

References
  • International Labour Organization (ILO). 2006. Global child labour trends 2000-2004. Geneva: ILO. (Download PDF, 640 KB)
  • United Nations Children's Fund (UNICEF). 2007a. Progress for children: A World Fit for Children statistical review. New York: UNICEF. (Download PDF, 3.6 MB)
  • United Nations Children's Fund (UNICEF). 2007b. The state of the world's children 2008: Child survival. New York: UNICEF. (Download PDF, 4.3 MB)
  • United Nations Statistics Division (UNSD). 2001. System of national accounts 1993. http://unstats.un.org/unsd/sna1993/toctop.asp.
Related articles
External links
Friedrich Huebler, 7 September 2008 (edited 5 October 2008), Creative Commons License
Permanent URL: http://huebler.blogspot.com/2008/09/child-labor.html

Wednesday, March 12, 2008

Regional distribution of children out of school

UNICEF estimates that 93 million children of primary school age were out of school in 2006. The graph below presents the regional distribution of these children according to the country classification used by UNICEF. The majority of children out of school, 41 million, lived in Sub-Saharan Africa, the region with the world's lowest primary school enrollment rates. In South Asia, 32 million children were out of school, most of them in India, the country with the world's largest population of children not in school.

In other regions, fewer children of primary school age were not in school. The Middle East and North Africa, East Asia and the Pacific, Latin America and the Caribbean, the industrialized countries, and the countries of Central and Eastern Europe and the Commonwealth of Independent States (CIS) combined account for 20 million children out of school, only one fifth of the global number.

Estimates for individual countries are available on the Childinfo website of UNICEF. The site also describes the data sources and methodology for UNICEF's calculation of the number of children out of school.

Regional distribution of children of primary school age out of school (in millions), 2006
Pie chart with the regional distribution of children out of primary school in 2006
Source: UNICEF, 2007, Progress for Children.

References
  • United Nations Children's Fund (UNICEF). 2007. Progress for children: A World Fit for Children statistical review. New York: UNICEF. (Download PDF, 3.6 MB)
Related articles

External links

Friedrich Huebler, 12 March 2008 (edited 8 February 2009), Creative Commons License
Permanent URL: http://huebler.blogspot.com/2008/03/regional-distribution-of-children-out.html

Sunday, February 24, 2008

UNICEF releases new MICS survey data

UNICEF has released the first datasets from the third round of Multiple Indicator Cluster Surveys (MICS), conducted in 2005 and 2006. The first round of MICS surveys was carried out around 1995, followed by a second round of surveys around 2000.

MICS surveys are nationally representative household surveys that were developed by UNICEF in collaboration with other organizations to collect data on the situation of children and women. The most recent round of surveys collected data on household characteristics, education, child labor, water and sanitation, child mortality, maternal and newborn health, knowledge of HIV and AIDS, contraceptive use, birth registration, and other areas. The data can be used to track progress toward the UN Millennium Development Goals and other goals. The MICS program is described in detail on the Childinfo website of UNICEF.

In the area of education, the latest MICS surveys provide data for the following household member characteristics:
  • highest level of education
  • current school attendance
  • school attendance in the previous year
  • literacy
With the data it is possible to calculate primary and secondary school enrollment rates, repetition and dropout rates, survival rates, and other education statistics. The MICS surveys also allow detailed disaggregation of the data, for example by gender, area of residence, or household wealth. Examples for the kind of analysis that is possible with MICS data can be seen in previous articles on this site, for example on child labor and school attendance in Bolivia, educational attainment in India, or years of schooling and literacy.

The MICS datasets are available for download in SPSS format from the Childinfo website. The datasets are provided free of charge but interested researchers have to apply for a MICS username and password. At the time of writing, datasets from the following countries were available: Bangladesh, Belarus, Côte d'Ivoire, Cuba, Jamaica, Mongolia, Montenegro, Serbia, Sierra Leone, and Uzbekistan. In addition, survey questionnaires, survey reports, and a set of standard tabulations are provided. The questionnaires, tables, and reports can be downloaded without access restrictions.

External links
Related articles
Friedrich Huebler, 24 February 2008, Creative Commons License
Permanent URL: http://huebler.blogspot.com/2008/02/unicef-releases-new-mics-survey-data.html

Sunday, January 27, 2008

The State of the World's Children 2008 by UNICEF

Cover of The State of the World's Children 2008 by UNICEFUNICEF released the 2008 edition of its annual publication The State of the World's Children on 22 January 2008. This year's report is dedicated to child survival and primary health care for children and their mothers.

In 2006, 9.7 million children died before they reached their fifth birthday. In spite of improvements in the area of child survival, the world is not on track to reach the Millennium Development Goal of reducing the rate of child mortality by two thirds between 1990 and 2015.

The State of the World's Children contains statistical tables with national data on nutrition, health, HIV and AIDS, education, demography, economy, women, and child protection. In the area of education, the report lists data for the following indicators:
  • Primary school enrollment and attendance
  • Secondary school enrollment and attendance
  • Survival rate to grade 5
  • Youth and adult literacy
The tables in The State of the World's Children complement the statistical review Progress for Children that was released by UNICEF in December 2007.

External links
Related articles
Friedrich Huebler, 27 January 2008 (edited 1 February 2009), Creative Commons License
Permanent URL: http://huebler.blogspot.com/2008/01/state-of-worlds-children-2008-by-unicef.html

Sunday, January 13, 2008

Universal primary education by 2015: A goal out of reach?

The new UNICEF publication Progress for Children compares data on children out of school by UNESCO and UNICEF. According to UNESCO, 72 million children of primary school age were out of school in 2005, down from 96 million in 1999. UNICEF estimates that 93 million children were out of school in 2005/2006, down from 115 million in 2002. Although both sets of data show a decline in the number of children out of school, they also indicate that the Millennium Development Goal of universal primary education by 2015 may be out of reach.

The graph below plots trend data on the number of children out of school calculated by UNESCO for the period 1999-2005 and by UNICEF for the period 2002-2006. (The 2002 estimate in the latter trend line is based on joint work by UNICEF and the UNESCO Institute for Statistics.) If we assume that the reduction in the number of children out of school continues at the same average rate as over the past years, more than 30 to 40 million children will still be out of school by 2015 and the international community will have failed in its efforts to secure primary education for all children.

Children out of school, 1999-2015
Graph with trend data on number of children out of school, 1999-2015
Data sources: UIS (2005), UNESCO (2007), UNICEF (2007).

References
  • UNESCO Institute for Statistics (UIS). 2005. Children out of school: Measuring exclusion from primary education. Montreal: UIS. (Download in PDF format, 4.9 MB)
  • UNESCO. 2007. Education for all by 2015: Will we make it? - EFA global monitoring report 2008. Paris: UNESCO. (Download in PDF format, 11.8 MB)
  • UNICEF. 2007. Progress for Children: A World Fit for Children Statistical Review. New York: UNICEF. (Download in PDF format, 3.6 MB)
Related articles
External links
Friedrich Huebler, 13 January 2008 (edited 8 February 2009), Creative Commons License
Permanent URL: http://huebler.blogspot.com/2008/01/universal-primary-education-by-2015.html

Saturday, December 15, 2007

UNICEF statistical review: Progress for Children

Cover of "Progress for Children: A World Fit for Children Statistical Review" by UNICEFOn 10 December 2007, UNICEF launched a new publication, Progress for Children: A World Fit for Children Statistical Review. With more than 60 pages of graphs and tables, the report draws a detailed statistical picture of the current state of the world's children. The publication is divided into sections organized by Millennium Development Goal.
  • MDG 1: Eradicate extreme poverty and hunger
  • MDG 2: Achieve universal primary education
  • MDG 3: Promote gender equality and empower women
  • MDG 4: Reduce child mortality
  • MDG 5: Improve maternal health
  • MDG 6: Combat HIV and AIDS, malaria and other diseases
  • MDG 7: Ensure environmental sustainability
An additional section has data on protection against abuse, exploitation, and violence.

Some findings of the report in the area of education are:
  • The number of children out of school has fallen from 115 million in 2002 to 93 million in 2005-2006.
  • More than three quarters of all children out of school worldwide live in Sub-Saharan Africa and South Asia.
  • Secondary school net attendance or enrollment rates are below 50 percent in many countries, including most of Africa.
  • Almost all countries in North and South America, Europe, Central Asia, and East Asia have reached the goal of gender parity in primary education.
  • Few countries have reached gender parity in secondary education.
  • Child labor, which interferes with education, is most prevalent in Sub-Saharan Africa.
Excerpt from Progress for Children: Data on primary and secondary education
Excerpt from "Progress for Children" by UNICEF: data on primary and secondary education
Source: UNICEF 2007: p. 14-15.

References
  • UNICEF. 2007. Progress for Children: A World Fit for Children Statistical Review. New York: UNICEF. (Download in PDF format, 3.6 MB)
Related articles
External links
Friedrich Huebler, 15 December 2007, Creative Commons License
Permanent URL: http://huebler.blogspot.com/2007/12/unicef-statistical-review-progress-for.html

Sunday, March 25, 2007

Education country profiles by UNICEF

In addition to its main web site at unicef.org, UNICEF maintains a separate web site at childinfo.org with a wide range of statistics on issues related to children and women. In the area of education, the Childinfo web site provides a complete set of country profiles with current statistics for 206 countries and territories, from Afghanistan to Zimbabwe. Complete profiles have three sections, with past trends, the current state of the education system, and prospects for 2015. The section on trends contains up to six graphs with data from 1980 to the present.
  • Pre-primary school gross and net enrollment rates
  • Primary school net enrollment and net attendance rates
  • Secondary school net enrollment and net attendance rates
  • Survival rate to grade 5
  • Pupil/teacher ratio
  • Education expenditures as percent of GDP and as percent of total government expenditures
The section on the current state of the education system lists up to two tables and six graphs.
  • Statistics from the education database of the UNESCO Institute for Statistics (UIS): population; official school ages; preschool, primary school, and secondary school enrollment; intake, transition rates, repetition, and completion rates; teaching staff; education expenditures
  • Statistics from a recent household survey, usually a Multiple Indicator Cluster Survey (MICS) or Demographic and Health Survey (DHS): primary and secondary school attendance; intake, transition, repetition, and completion rates
  • Three graphs on disparity in primary school attendance - by gender, area of residence, and household wealth - with data from a recent household survey
  • Three graphs on gender disparity in secondary school - by gender, area of residence, and household wealth - with data from a recent household survey
For countries with household survey data, two final graphs show school attendance rates between 2000 and 2015, the target year for the UN Millennium Development Goals.
  • Predicted primary school net attendance rate, by gender
  • Predicted secondary school net attendance rate, by gender
The level of detail of the country profiles varies, depending on the availability of education statistics for each country. The profile for North Korea, shown in Figure 1, has only two pages and contains virtually no data. In contrast, the country profile for the Philippines, shown in Figure 2, has seven pages with fourteen graphs and two tables and provides data for all indicators listed above.

Figure 1: Education country profile for North Korea
UNICEF's education country profile for North Korea
Source: UNICEF Childinfo web site, childinfo.org, March 2007.

Figure 2: Education country profile for the Philippines
UNICEF's education country profile for the Philippines
Source: UNICEF Childinfo web site, childinfo.org, March 2007.

On the Childinfo web site, all countries are grouped by UNICEF region. The majority of the data in the country profiles is from the UNESCO Institute for Statistics and from MICS and DHS surveys.

Related articles
External links
Friedrich Huebler, 25 March 2007, Creative Commons License
Permanent URL: http://huebler.blogspot.com/2007/03/education-country-profiles-by-unicef.html

Saturday, March 10, 2007

Nepal: trends in primary education, 1980-2004

Nepal is one of UNICEF's 25 priority countries for girls' education. Countries were selected if they met three or more of the following criteria:
  • female primary school net enrollment rate below 70 percent,
  • gender gap in primary education above 10 percent,
  • more than 1 million girls out of school,
  • included in the Education for All Fast Track Initiative,
  • affected by crises like HIV/AIDS and military conflict.
In Nepal, the primary school net enrollment rate (NER) of girls was historically below 70 percent and much lower than the NER of boys, with a gender gap above 10 percent. Nepal also suffers from the consequences of a long-running Maoist insurgency. Two other criteria are not met by Nepal. The country is not on the list of countries covered by the Fast Track Initiative, and the number of girls out of school is below 1 million. A recent publication by UNICEF and the UNESCO Institute for Statistics, Children out of school: Measuring exclusion from primary education, estimates that around 500,000 girls and 400,000 boys of primary school age were not attending school in Nepal.

Trend data on enrollment and attendance, plotted in the following graph, shows that the primary school participation rate of girls has increased substantially since the 1980s. On the other hand, the participation rate of boys has remained relatively stable. As a result, the difference between male and female enrollment or attendance rates has decreased from more than 40 percent to roughly 10 percent over the past 25 years.

Nepal: trends in primary education, 1980-2004
Graph with trends in primary school enrollment and attendance, 1980-2004
Data sources: UNESCO Institute for Statistics, Demographic and Health Survey, Multiple Indicator Cluster Survey, Nepal Living Standards Survey.

The graph combines data from a variety of sources.
The data from UNESCO measures primary school enrollment, the data from the three household surveys - DHS, MICS, and NLSS - measures primary school attendance. The net enrollment rate (NER) is the share of children of primary school age that are enrolled in primary school. The net attendance rate (NAR) is the share of children of primary school age that attend primary school. The official primary school age in Nepal is 5 to 9 years.

In spite of some differences, the overall trends in enrollment and attendance are similar. Male NER or NAR values have hovered around 80 percent since the 1980s. In 1983, the NER of boys was 78 percent; in 2003, it was 83 percent. The latest data on primary school attendance is from a Nepal Living Standard Survey (NLSS) conducted in 2003/04. For boys, the net attendance rate at that time was 78 percent.

The female primary school NER was at 33 percent in 1983 but it more than doubled to 73 percent in 2003. The NAR of girls was 67 percent in 2003/04 according to the most recent household survey data. Because of the increase in primary school participation of girls, the gender parity index - the ratio of female to male NER or NAR values - grew from 0.4 in 1983 to more than 0.8 by 2003. If this trend continues, Nepal will reach gender parity in primary education in the coming years. However, additional progress is needed to reach the Millennium Development Goal of universal primary education by 2015.

Related articles
External links
Friedrich Huebler, 10 March 2007 (edited 12 October 2008), Creative Commons License
Permanent URL: http://huebler.blogspot.com/2007/03/nepal-trends-in-primary-school.html