Showing posts with label poverty. Show all posts

Sunday, October 12, 2008

Education disparity in South Asia

Cover of "Beyond gender: Measuring disparity in South Asia using an education parity index" by Friedrich HueblerA new publication by Friedrich Huebler describes education disparity in the countries of South Asia. The report Beyond gender: Measuring disparity in South Asia using an education parity index was published by the UNICEF regional office for South Asia in its series of papers on girls' education.

Analysis of disparities in national education systems is often limited to gender although other dimensions of disparity are also important. The publication presents data on disparity in primary and secondary education by gender, area of residence and household wealth for countries in South Asia.

To facilitate the interpretation of complex data a newly developed Education Parity Index is introduced. The EPI combines information on disparities across different education indicators and across different groups of disaggregation. This distinguishes the EPI from existing indicators of disparity in education, including the gender parity index and the EFA development index. The EPI is flexible and can be modified according to national priorities, for example by including information on disparities between different ethnic groups.

The use of the EPI as a tool to assess education disparities is illustrated with household survey data from Afghanistan, Bangladesh, India, Nepal and Pakistan. For each country, the report describes how the EPI is calculated. In addition, national trends in education disparity from 1996 to 2006 are presented.

References
  • Huebler, Friedrich. 2008. Beyond gender: Measuring disparity in South Asia using an education parity index. Kathmandu: UNICEF. (Download PDF document, 194 KB)
External links
Related articles
Friedrich Huebler, 12 October 2008 (edited 30 January 2009), Creative Commons License
Permanent URL: http://huebler.blogspot.com/2008/10/epi.html

Sunday, August 24, 2008

Household wealth and years of education

At the national level, a country's wealth (measured by GDP per capita) and the education of its population (measured by school life expectancy) are highly correlated, as demonstrated in an article on national wealth and years of education. In developed countries with a high level of national income the population usually has more years of education than the population of low income countries.

A similar link can be observed at the level of individual households. Households whose members have a higher level of education are usually wealthier than households with less educated members. The relationship between household wealth and education can be analyzed with data from household surveys. This article looks at data from 12 nationally representative household surveys that were conducted between 2004 and 2006 in Bangladesh, Cambodia, Colombia, Egypt, Ethiopia, Haiti, India, Moldova, Nepal, Niger, Sierra Leone, and Zimbabwe. The data from Bangladesh and Sierra Leone is from Multiple Indicator Cluster Surveys (MICS) and the data from the other countries was collected with Demographic and Health Surveys (DHS).

DHS and MICS surveys collect data on assets owned by a household - for example, water supply and sanitation facilities, housing material, radio, telephone, refrigerator, bicycle, automobile, and livestock - that can be used to construct an index of household wealth (Filmer and Pritchett 2001). With this index it is possible to rank the households in a survey from poorest to richest. The households can then be divided into wealth deciles, each containing 10 percent of the sample population.

DHS and MICS surveys also collect data on the education of all household members above a certain age, usually 5 to 7 years. For the analysis in this article, the years of formal education of all household members aged 20 to 65 years were examined. For example, a person that did not complete primary school may have 3 years of education while someone with a university degree may have 16 years of education. In the next step, the average number of years of education within each wealth decile is calculated.

The data on household wealth and years of education is plotted in the graph below. Wealth deciles are plotted along the horizontal axis. The average number of years of education of persons aged 20 to 65 years in each wealth decile is plotted along the vertical axis. As an example, in Bangladesh, persons in the poorest decile have 1.3 years of education on average and persons in the richest decile have 10.1 years of education.

Household wealth and years of education
Graph showing the link between household wealth and average years of education
Data source: Demographic and Health Surveys (DHS), Multiple Indicator Cluster Surveys (MICS), 2004-2006.

The graph shows that an increase in the average years of education of all adult household members is correlated with an increase in household wealth. This relationship is true without exception in all 12 countries that were analyzed. Persons in higher wealth deciles always have more years of education than persons in lower deciles.

The graph also shows that the disparity between poorer and richer households in terms of education varies from country to country. In Moldova, almost everyone attends primary and secondary school and even in the poorest decile the average number of years of education is 9.3, compared to 13.6 years of education in the richest decile. In Zimbabwe, most persons attended at least primary school; persons in the poorest decile have 5.4 years of education on average and persons in the richest decile 11.4 years.

In contrast, Niger is a country where few persons between 20 and 65 years of age attended school. 80 percent of the population have less than 1 year of education. The average number of years of education is 0.3 in the poorest decile, 0.9 in the eighth decile, 1.8 in the ninth decile, and 5.3 in the richest decile. In Ethiopia, 80 percent of the adult population have fewer than 2 years of education and in Sierra Leone, 70 percent have fewer than 2 years of education. Cambodia and Nepal are also countries where a large part of the population has relatively little formal education.

In other countries, the increase in the number of years of education from poorer to richer deciles is more pronounced. In Egypt, persons in the poorest decile have 3.1 years of education on average and those in the richest decile have 13.8 years of education. In India, the average number of years of education is 1.4 in the poorest decile and 11.9 in the richest decile. In Haiti, the respective numbers are 1.2 and 10.7 years of education. In Colombia, the average number of years of education ranges from 3.6 in the poorest decile to 12.5 in the richest decile.

The positive link between wealth and years of education at the household level can be explained similarly to the link between these two variables at the national level. Persons with a higher level of education can earn more than those with less education. At the same time, members of wealthier households can afford education more easily than members of poorer households. At the extreme end, very poor families may not only lack the financial resources to send their children to school, they may also have to rely on the income from child labor to guarantee the survival of everyone in the household. This relationship between household wealth and child labor was analyzed in two articles on child labor and school attendance in Bolivia.

Reference
  • Filmer, Deon, and Lant H. Pritchett. 2001. Estimating wealth effects without expenditure data - or Tears: An application to educational enrollments in states of India. Demography 38 (1), February: 115-132.
Related articles
External links
Friedrich Huebler, 24 August 2008, Creative Commons License
Permanent URL: http://huebler.blogspot.com/2008/08/hh-wealth.html
Sunday, August 3, 2008

National wealth and years of education

A country's national wealth and the education of its population are highly correlated. In developed countries with a high level of national income the population usually has more years of education than the population of low income countries. Countries with a highly educated work force can achieve higher economic growth rates and at the same time wealthy countries have the financial resources to invest more in education.

The relationship between national wealth and years of education can be illustrated with a comparison of national data on school life expectancy (SLE) and gross domestic product (GDP) per capita. The school life expectancy is the average number of years a child of school entrance age is expected to spend in primary, secondary or tertiary education. GDP per capita is the total value of all goods and services produced in a country, divided by its population.

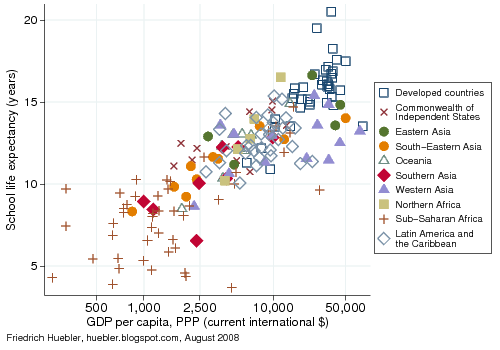
The graph below plots the school life expectancy against GDP per capita in 2006, the year with the most recent data. The GDP data was adjusted with purchasing power parities (PPP) to account for differences in the price levels between countries. To emphasize the shape of the relationship with school life expectancy the GDP data is plotted on a logarithmic scale. In total, data for 175 countries was available. Each country is identified by a marker that indicates the Millennium Development Goal (MDG) region in which it is located.

The graph clearly demonstrates that GDP per capita is positively correlated with school life expectancy. The upper right corner of the graph is populated mainly by developed countries with a high GDP per capita and a long school life expectancy. The countries with the highest school life expectancy are Australia (SLE 20.5 years, GDP per capita $35,500), New Zealand (SLE 19.5 years, GDP per capita $25,500), and Iceland (SLE 18.2 years, GDP per capita $36,900). The countries with the lowest school life expectancy are Angola (SLE 3.7 years, GDP per capita $4,400), Niger (SLE 3.9 years, GDP per capita $630), and the Democratic Republic of the Congo (SLE 4.3 years, GDP per capita $280). The Democratic Republic of the Congo has the lowest GDP per capita of all countries with data.

GDP per capita and school life expectancy, 2006
Scatter plot of school life expectancy and GDP per capita in 175 countries
Data sources: UNESCO Institute for Statistics, World Bank, UN Population Division.

The following table lists the average school life expectancy, the average GDP per capita, and the total population in each MDG region and for the world as a whole. At the global level, the average school life expectancy is 11.5 years and the average GDP per capita is $9,300. Developed countries have the highest school life expectancy (15.8 years) and the highest GDP per capita ($33,500). Countries in Latin America and the Caribbean and members of the Commonwealth of Independent States (the former Soviet Union) also have a high school life expectancy (13.5 years and 13.4 years, respectively) but at lower levels of GDP per capita ($9,100 and $9,400).

In Northern Africa, the average school life expectancy is 12.2 years, with a GDP per capita around $5,400. In Eastern Asia, South-Eastern Asia, Oceania, and Western Asia, the school life expectancy ranges from 11 to 11.4 years. Western Asia, which includes the oil-rich countries of the Middle East, is the region with the second highest GDP per capita ($11,400) but school life expectancy is the third lowest of all ten MDG regions. Southern Asia has the second lowest school life expectancy with 9.6 years and an average GDP per capita of $2,600. The lowest school life expectancy is observed in Sub-Saharan Africa (7.7 years) and this region also has the lowest GDP per capita ($1,800).

MDG regions: school life expectancy, GDP per capita, and total population, 2006
MDG region School life expectancy (years) GDP per capita, PPP (current international $) Total population (1,000)
Developed countries 15.8 33,508 1,015,487
Commonwealth of Independent States 13.4 9,371 278,295
Eastern Asia 11.4 5,471 1,402,837
South-Eastern Asia 11.3 4,190 565,105
Oceania 11.4 2,323 8,804
Southern Asia 9.6 2,649 1,612,841
Western Asia 11.0 11,394 200,205
Northern Africa 12.2 5,433 155,086
Sub-Saharan Africa 7.7 1,818 788,122
Latin America and the Caribbean 13.5 9,109 564,732
World 11.5 9,262 6,591,513
Data sources: UNESCO Institute for Statistics, World Bank, UN Population Division. Regional averages are weighted by each country's total population.

A related article on this site analyzes the link between national wealth and school enrollment at the primary and secondary level of education. Countries with a high GDP per capita usually have higher net enrollment rates than countries with a low GDP per capita. This relationship is particularly strong at the secondary level of education. Two articles on poverty and educational attainment in the United States examine poverty rates and high school graduation rates in the 50 U.S. states.

Data sources
Related articles
External links
Friedrich Huebler, 3 August 2008 (edited 28 August 2008), Creative Commons License
Permanent URL: http://huebler.blogspot.com/2008/08/wealth.html

Sunday, July 27, 2008

A view inside primary schools

Cover of "A view inside primary schools" by UISA new publication by the UNESCO Institute for Statistics, A view inside primary schools: A World Education Indicators (WEI) cross-national study, presents new data on quality and equality in primary education. The data is from 11 countries in Asia, Latin America, and North Africa that participated in the Survey of Primary Schools by the World Education Indicators Programme in 2005 and 2006. For the survey, fourth grade teachers and principals from over 7,600 schools responded to questions about teaching and learning conditions.

The countries in the study - Argentina, Brazil, Chile, India, Malaysia, Paraguay, Peru, Philippines, Sri Lanka, Tunisia, and Uruguay - are close to the Millennium Development Goal of universal primary education. However, the survey reveals large resource gaps between schools in urban and rural areas. Children in poorly equipped and maintained schools often come from poor families and these children are thus doubly disadvantaged.

Other findings of the survey include:
  • In Paraguay, the Philippines, and Sri Lanka, more than one in five pupils attended schools without running water.
  • In India, Paraguay, Peru, the Philippines, Sri Lanka, and Tunisia, less than half of all pupils were in schools with a telephone.
  • Sri Lanka was the only country participating in the survey that provided free textbooks to virtually all pupils.
  • The overall weekly teaching load for Grade 4 teachers working in only one school ranged from 14 hours in Malaysia to 31 hours in Chile and the Philippines. The average teaching load was 23 hours per week.
  • In all countries in the survey - except in India, Malaysia, and Sri Lanka - most teachers expressed low levels of satisfaction with their salaries.
The full report, with detailed tables and figures, is available for download at the UIS website.

External links
Related articles
Friedrich Huebler, 27 July 2008 (edited 26 October 2008), Creative Commons License
Permanent URL: http://huebler.blogspot.com/2008/07/primary-schools.html

Sunday, January 20, 2008

Secondary school attendance in India in 2006

In India, 83 percent of all children of primary school age (6-10 years) attend primary school, as described in a previous article on this site. Primary school net attendance rates (NAR) are highest in urban areas and among children from the richest households.

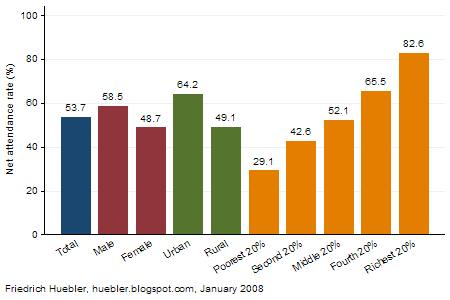
Fewer children continue their education at the secondary level. Data from a nationally representative Demographic and Health Survey (called National Family Health Survey in India) conducted in 2005 and 2006 shows that only 54 percent of all children of secondary school age (11-17 years) attend secondary school. In addition, there are large disparities between different groups of children, as the graph below demonstrates. Boys and children from urban areas are more likely to be in secondary school than girls and children from rural areas.

Secondary school net attendance rate (NAR), India 2006
Bar graph showing secondary school net attendance rate in India in 2006
Data source: India Demographic and Health Survey 2005-06.

The biggest disparities exist between children from different wealth quintiles. Among children from the richest 20 percent of all households, the secondary NAR is 83 percent, compared to a secondary NAR of only 29 percent among children from the poorest households. The respective primary NAR values are 96 percent for children from the richest quintile and 69 percent for children from the poorest quintile. Children from poor households are not only less likely to enter school than children from wealthier households, they are also far less likely to continue their education after four years of primary school.

References
  • International Institute for Population Sciences (IIPS), and Macro International. 2007a. National Family Health Survey (NFHS-3) 2005-06, India: Volume 1. Mumbai: IIPS. (Download in PDF format, 7.9 MB)
  • International Institute for Population Sciences (IIPS), and Macro International. 2007b. National Family Health Survey (NFHS-3) 2005-06, India: Volume II. Mumbai: IIPS. (Download in PDF format, 4.1 MB)
Related articles
External links
Friedrich Huebler, 20 January 2008 (edited 12 October 2008), Creative Commons License
Permanent URL: http://huebler.blogspot.com/2008/01/secondary-school-attendance-in-india-in.html

Monday, November 19, 2007

Primary school attendance in India in 2006

21 million children of primary school age in India were out of school in 2006, more than in any other country. Compared to 2000, the number of children out of school has fallen by 9 million, but the Millennium Development Goal of universal primary education by 2015 can only be met if the increase in primary school attendance accelerates in the coming years.

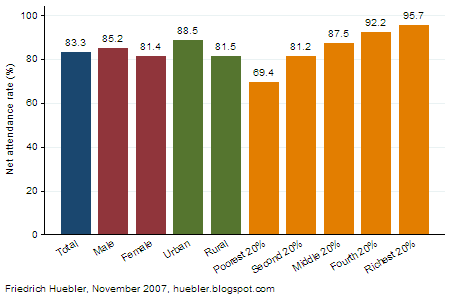
According to data from a nationally representative Demographic and Health Survey (DHS), the primary school net attendance rate (NAR) in India was 83 percent in 2006. (In India, the DHS is referred to as National Family Health Survey or NFHS.) In other words, more than 8 out of 10 children of primary school age (6-10 years in India) were attending primary school. In 2000, the primary school net attendance rate was 76 percent. Although the attendance rate has increased, there are persistent disparities in the education system of India. The bar graph below displays the primary school NAR by sex, area of residence, and household wealth. 85 percent of all boys and 81 percent of all girls are in school and the country is therefore close to gender parity. On the other hand, there is a larger gap between urban and rural areas. The urban primary NAR is 89 percent and the rural NAR is 82 percent.

Primary school net attendance rate (NAR), India 2006
Bar graph showing primary school net attendance rate in India in 2006
Data source: India Demographic and Health Survey 2005-06

Disaggregation by household wealth reveals even greater disparities. 96 percent of all primary-school-age children from the richest household quintile are in school. With declining household wealth, the share of children in school also falls. In the poorest household quintile, the primary NAR is only 69 percent, almost one third below the NAR in the richest households. As a consequence, children from the poorest households make up almost half of all children out of school in India. An earlier article on this site contains additional data on children out of school in India.

Note on NAR calculation

The official report for the India DHS lists the primary NAR as 71.9 percent (IIPS and Macro International 2007a, Table 2.8, page 31). The primary NAR cited above, 83.3 percent, is higher because of a different calculation method. The DHS report uses the traditional definition of the primary school net attendance rate, which only considers attendance in primary school and ignores attendance at higher levels of education.
  • Primary NAR (traditional definition) = Number of children of primary school age in primary school / Total number of children of primary school age
A joint report by UNESCO and UNICEF, Children out of school: Measuring exclusion from primary education (UNESCO Institute for Statistics 2005), introduced a revised method to calculate the primary NAR. In contrast to the traditional calculation method, school attendance at primary or higher levels of education is considered.
  • Primary NAR (revised definition) = Number of children of primary school age in primary school or higher / Total number of children of primary school age
In countries like India, where a relatively large number of children of primary school age are already in secondary school, the traditional calculation method underestimates the true level of participation in the education system and overestimates the number of children out of school. During an assessment of progress toward universal primary education, the primary NAR published in the final DHS report would lead to the wrong conclusion that almost 30 percent of all children of primary school age are not in school in India. In fact, fewer than 17 percent of all children of primary school age are not in school.

References
  • International Institute for Population Sciences (IIPS), and Macro International. 2007a. National Family Health Survey (NFHS-3) 2005-06, India: Volume 1. Mumbai: IIPS. (Download in PDF format, 7.9 MB)
  • International Institute for Population Sciences (IIPS), and Macro International. 2007b. National Family Health Survey (NFHS-3) 2005-06, India: Volume II. Mumbai: IIPS. (Download in PDF format, 4.1 MB)
  • UNESCO Institute for Statistics (UIS). 2005. Children out of school: Measuring exclusion from primary education. Montreal: UIS. (Download in PDF format, 4.9 MB)
Related articles
External links
Friedrich Huebler, 19 November 2007 (edited 12 October 2008), Creative Commons License
Permanent URL: http://huebler.blogspot.com/2007/11/primary-school-attendance-in-india-in.html

Tuesday, November 13, 2007

India has 21 million children out of school

India is the country with the largest number of children out of school. India has more children of school age than China and at the same time relatively low attendance rates, in spite of recent increases in primary and secondary school participation.

Newly released data from a Demographic and Health Survey (DHS) show that the primary school attendance rate has increased by more than one percentage point annually since the beginning of the decade. In 2000, 76 percent of all children of primary school age (6-10 years) were in school. By 2006, this value had increased to 83 percent (see Table 1). The attendance rate of girls increased by 9 percent over the 2000-2006 period and the attendance rate of boys by 6 percent. School attendance rates also grew in urban and rural areas, and across all household wealth quintiles. However, close to 17 percent of all children of primary school age continue to be out of school.

Table 1: Children of primary school age in school (percent), India 2000 and 2006

2000 2006 Change 2000 to 2006
Male 79.2 85.2 5.9
Female 72.3 81.4 9.1
Urban 82.5 88.5 5.9
Rural 73.8 81.5 7.7
Poorest 20% 66.1 69.4 3.2
Second 20% 69.2 81.2 12.1
Middle 20% 78.8 87.5 8.7
Fourth 20% 82.1 92.2 10.1
Richest 20% 89.1 95.7 6.6
Total 75.9 83.3 7.5
Data sources: India Multiple Indicator Cluster Survey (MICS) 2000, India DHS 2005-06.

As a result of the increase in primary school attendance, the number of children out of school fell by almost one third from 30 million in 2000 to 21 million in 2006 (see Table 2). This pattern could be observed for boys and girls, and for residents of urban and rural areas. However, disaggregation by household wealth reveals that one group of children did not follow the nationwide trend. Among the poorest 20 percent of all households, the number of children out of school grew from 9.4 million in 2000 to 9.8 million in 2006. Although the primary school net attendance rate among children from the poorest households grew by 3 percentage points from 2000 to 2006 (see Table 1), this increase was not strong enough to keep pace with population growth in the poorest segment of the Indian population.

Table 2: Children of primary school age out of school (million), India 2000 and 2006

2000 2006 Change 2000 to 2006
Male 13.0 9.5 -3.5
Female 16.4 11.2 -5.2
Urban 5.0 3.7 -1.3
Rural 24.5 17.0 -7.5
Poorest 20% 9.4 9.8 0.5
Second 20% 8.5 5.3 -3.2
Middle 20% 5.2 3.1 -2.1
Fourth 20% 4.3 1.7 -2.6
Richest 20% 2.0 0.8 -1.3
Total 29.5 20.7 -8.7
Data sources: India MICS 2000, India DHS 2005-06.

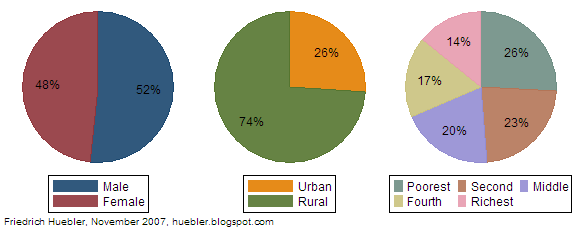
A comparison of the composition of the total population of primary school age and the population of children out of school shows which group of children are disproportionately more likely to miss out on education. Figure 1 shows the composition of the Indian population aged 6 to 10 years. 52 percent of all children in this age group are boys and 48 percent are girls. About one quarter of all children of primary school age live in urban areas and the remaining three quarters in rural areas.

Wealth quintiles are constructed by ranking the entire population of India, regardless of age, according to household wealth and dividing them into five equally sized groups with 20 percent each of the total population. As Figure 1 shows, households from poorer quintiles are more likely to have children than households from richer quintiles. Overall, 26 percent of all children between 6 and 10 years live in the bottom quintile and a further 23 percent in the second quintile.

Figure 1: Population of primary school age by sex, area of residence, and wealth quintile, India 2006
Pie charts showing composition of population of primary school age, India 2006
Data source: India Demographic and Health Survey 2005-06.

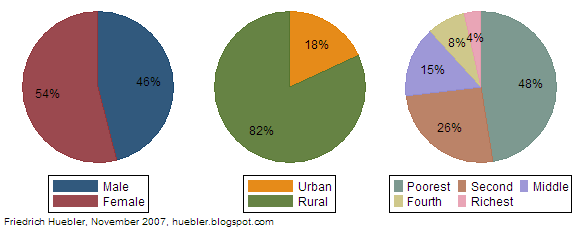
Figure 2: Children of primary school age out of school by sex, area of residence, and wealth quintile, India 2006
Pie charts showing composition of group of children of primary school age out of school, India 2006
Data source: India Demographic and Health Survey 2005-06.

Figure 2 shows the composition of the group of children aged 6 to 10 years that are out of school. Although girls only account for 48 percent of the total number of children in this age group, they make up 54 percent of the children out of school. Rural children are disproportionately more likely to be out of school than urban children. Most strikingly, children from the poorest quintile make up almost half of all children out of school. 48 percent - 10 million of the 21 million children out of school - live in the poorest quintile. 74 percent of all children out of school live in the two poorest quintiles.

These numbers emphasize the close link between poverty and school attendance in India. School attendance rates have increased among the poorest households between 2000 and 2006 but the increase was not large enough to keep pace with population growth. Unless India places more emphasis on school attendance among the poor, the country will miss the Millennium Development Goal of universal primary education by 2015.

Related articles
External links
Friedrich Huebler, 13 November 2007 (edited 12 October 2008), Creative Commons License
Permanent URL: http://huebler.blogspot.com/2007/11/india-has-21-million-children-out-of.html

Wednesday, September 26, 2007

Secondary school attendance in Nepal, 1996-2006

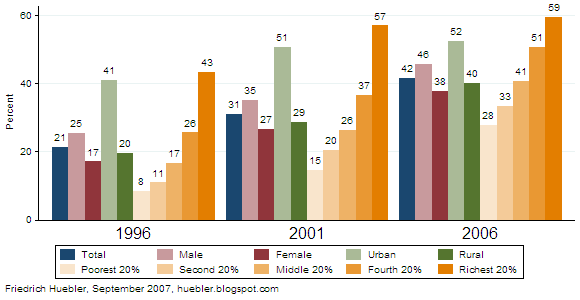
Over the past decade, the primary school net attendance rate (NAR) in Nepal increased from 65 percent in 1996 to 84 percent in 2006. At the secondary level of education, school attendance rates have also grown over the same period according to data from three Demographic and Health Surveys (DHS), shown in the graph and table below.

In 1996, only one in five children of secondary school age attended secondary school. By 2006, the secondary school NAR had doubled from 21 percent to 42 percent. The biggest relative increase was observed among the poorest households. In the poorest household quintile, the secondary school NAR more than tripled from 8 percent in 1996 to 28 percent in 2006. Most of this increase occurred over the period 2001 to 2006, when attendance rates in the richest households grew only marginally.

Secondary school net attendance rate (%), Nepal 1996-2006
Bar graph with trends in secondary school attendance in Nepal, 1996-2006
Data source: Nepal Demographic and Health Surveys, 1996, 2001, 2006.

The attendance rates of boys and girls grew by more than 20 percent between 1996 and 2006. The absolute gap between the two groups stayed the same, around 8 percent. The relative gap, measured by the gender parity index, the ratio of female to male attendance rate, improved from 0.67 to 0.83. The latest value is below the gender parity index in primary education, 0.95, but it brings the country closer to the Millennium Development Goal of gender parity in primary and secondary education.

Rural children managed to reduce the gap with urban children. In 1996, the secondary school NAR in urban areas was twice as high as in rural areas (41 versus 20 percent) but by 2006 the NAR in rural areas had doubled to 40 percent, while the NAR in urban areas grew to 52 percent.

Secondary school net attendance rate (%), Nepal 1996-2006

1996 2001 2006 Change 1996 to 2006
Total 21.3 30.9 41.7 20.4
Male 25.4 35.1 45.7 20.3
Female 17.1 26.6 37.8 20.8
Urban 40.9 50.6 52.4 11.5
Rural 19.5 28.7 40.1 20.5
Poorest 20% 8.4 14.6 27.8 19.4
Second 20% 10.9 20.5 33.3 22.4
Middle 20% 16.7 26.4 40.6 23.9
Fourth 20% 25.6 36.5 50.8 25.2
Richest 20% 43.3 57.0 59.5 16.1
Data source: Nepal Demographic and Health Surveys, 1996, 2001, 2006.

Related articles
External links
Friedrich Huebler, 26 September 2007 (edited 12 October 2008), Creative Commons License
Permanent URL: http://huebler.blogspot.com/2007/09/secondary-school-attendance-in-nepal.html

Tuesday, August 14, 2007

Primary school attendance in Nepal, 1996-2006

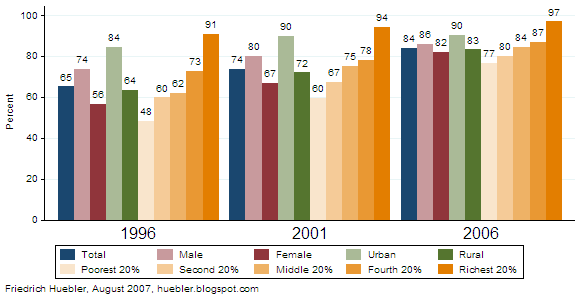
In 2006, a Demographic and Health Survey (DHS) collected data on school attendance in Nepal. A comparison with data from earlier DHS surveys, conducted in 1996 and 2001, shows a steady increase in primary school attendance over the last decade. The primary school net attendance rate (NAR) - the share of children of primary school age who attend primary school - has increased by almost 10 percentage points every five years, from 65 percent in 1996 to 84 percent in 2006. If Nepal can sustain this rate of increase it will reach the Millennium Development Goal of universal primary education by 2015.

The increase in attendance was accompanied by a reduction in disparities between boys and girls, residents of urban and rural areas, and children from different household wealth quintiles (see the graph and table below). Much of the increase in primary school attendance is due to higher attendance rates in rural areas, especially over the period 2001 to 2005, when attendance in urban areas grew only marginally.

Primary school net attendance rate (%), Nepal 1996-2006
Bar graph with trends in primary school attendance in Nepal, 1996-2006
Data source: Nepal Demographic and Health Surveys, 1996, 2001, 2006.

Children from the poorest 20 percent of all households saw the biggest increase in primary school attendance, from 48 percent in 1996 to 77 percent 2006. The difference in the primary NAR between children from the richest and poorest household quintiles fell by more than half over the same period, from 42 percent in 1996 to 20 percent in 2006.

Nepal also achieved a marked reduction in gender disparity over the past 10 years. In 1996, only 56 percent of all girls of primary school age attended primary school. This share grew to 82 percent by 2006. The primary NAR of boys grew from 74 percent to 86 percent over the same period. With a gender parity index (GPI) of 0.95 - the ratio of female to male NAR - Nepal has almost reached the Millennium Development Goal of gender parity in primary education.

Primary school net attendance rate (%), Nepal 1996-2006

199620012006Change 1996 to 2006
Total65.173.584.119.0
Male73.679.986.012.3
Female56.466.882.025.6
Urban84.389.890.25.9
Rural63.672.083.219.6
Poorest 20%48.459.676.728.3
Second 20%59.767.479.820.1
Middle 20%62.075.184.322.3
Fourth 20%72.678.286.914.3
Richest 20%90.694.396.96.2
Data source: Nepal Demographic and Health Surveys, 1996, 2001, 2006.

Comments on the 2006 DHS data

The authors of the final survey report from the 2006 DHS in Nepal counted children in school-based pre-primary centers as primary school students for the calculation of the primary school NAR. Children in informal, community based preschool classes were excluded from the calculation of the primary NAR. The author of this article chose the same approach.

A UNESCO country profile of Nepal prepared for the Education for All Global Monitoring Report 2007 explains that "there are significant differences in the way the school based and the community based [early childhood development centres] are running. Most of the school based centres are run by the DEO [District Education Office], and most of them are more primary schools than development centres."

The statement by UNESCO supports the treatment of children in school-based pre-primary centers in Nepal as equivalent to children in primary school for statistical purposes. In developing countries it is not uncommon to find children of primary school age in preschool but because of national differences the interpretation of the data from Nepal cannot necessarily be applied to other countries.

Related articles
External links
Friedrich Huebler, 14 August 2007 (edited 12 October 2008), Creative Commons License
Permanent URL: http://huebler.blogspot.com/2007/08/primary-school-attendance-in-nepal-1996.html

Monday, April 30, 2007

Primary and secondary school attendance in Nepal

Nepal is a country with historically large gender disparities in school attendance, where girls were much less likely than boys to receive a formal education. Since the 1980s the country has made remarkable progress toward gender parity in the education system so that the Millennium Development Goal of gender parity in primary and secondary education appears to be within reach. The trends in primary school attendance are discussed in detail in the article "Nepal: trends in primary education, 1980-2004" that was posted on this site in March 2007.

The present article takes a closer look at primary and secondary school attendance rates in Nepal. The data was collected in a Demographic and Health Survey (DHS) in 2001. DHS surveys are nationally representative household surveys that are carried out with support from the U.S. Agency for International Development. With the DHS data it is possible to examine disparities in the education system that go beyond gender.

In Nepal, the official primary school age is 5 to 9 years. The official secondary school age is 10 to 16 years. The primary school net attendance rate (NAR) in 2001 is shown in Figure 1 and the secondary school NAR in Figure 2.

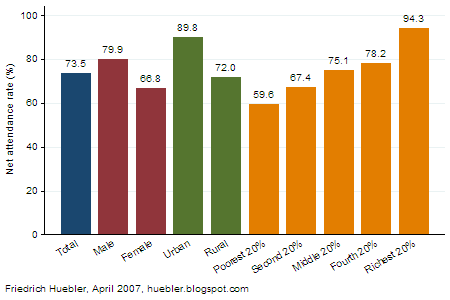
Overall, 73.5 percent of all children of primary school age were attending primary school. In spite of the progress toward gender parity over the past two decades, girls still attend primary school to a lesser degree than boys. The primary NAR of girls is 66.8 percent, compared to 79.9 percent for boys. However, other disparities in school attendance are larger than the male-female disparity. In rural areas, 72.0 percent of children of primary school age are in school, compared to 89.8 percent in urban areas. The biggest disparities are linked to household wealth. In the richest 20 percent of all household in Nepal, the primary NAR is 94.3 percent. As household wealth declines, the primary NAR also falls and among children from the poorest 20 percent of all households, the primary NAR is only 59.6 percent.

Figure 1: Primary school attendance in Nepal
Bar graph showing primary school net attendance rate in Nepal
Source: Nepal 2001 Demographic and Health Survey (DHS).

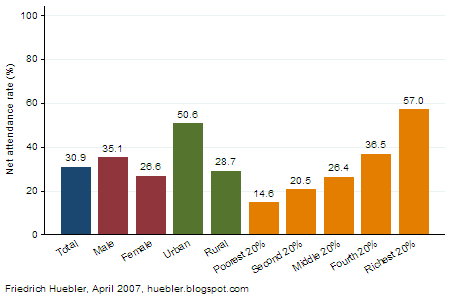
Less than half of all Nepali children continue their education at the secondary level. In the country as a whole, 30.9 percent of all children of secondary school age attend secondary school. Among boys, the secondary NAR is 35.1 percent, compared to 26.6 percent among girls. As at the primary level, the disparities linked to the area of residence and to household wealth are larger than the disparities linked to gender. In urban areas, the secondary NAR is 50.6 percent and in rural areas it is 28.7 percent. One likely explanation for this difference is the scarcity of secondary schools in rural Nepal. The link between poverty and school attendance at the secondary level of the education system is even stronger than at the primary level. For children from the richest 20 percent of all households, the secondary NAR is 57.0 percent. Among the poorest 20 percent of all households the secondary NAR is 14.6 percent, less than a quarter of the NAR in the richest households.

Figure 2: Secondary school attendance in Nepal
Bar graph showing secondary school net attendance rate in Nepal
Source: Nepal 2001 Demographic and Health Survey (DHS).

In conclusion, whereas Nepal has been able to move towards gender disparity in its education system, children from rural areas and from poorer households continue to be at a great disadvantage.

Note: In this article, the primary school NAR is defined as the share of children of primary school age who are attending primary or secondary school. Attendance at the secondary level is included because children of primary school age in secondary school would otherwise be counted as out of school. Similarly, the secondary school NAR counts children of secondary school age in secondary or higher education as attending secondary school.

Related articles
External links
Friedrich Huebler, 30 April 2007 (edited 12 October 2008), Creative Commons License
Permanent URL: http://huebler.blogspot.com/2007/04/primary-and-secondary-school-attendance.html

Monday, July 31, 2006

Child labor and school attendance in Bolivia, part 2

Child labor interferes with school attendance and is therefore an obstacle to the Millennium Development Goal of universal primary education. In Bolivia, 90 percent of all children between 5 and 14 years of age attend school. At the same time, one third of all children in this age group are engaged in child labor, as shown in a previous post on child labor and school attendance in Bolivia.

For the purpose of this analysis, child labor is defined as any economic activity during the week of the survey, or more than two hours of household chores per day. The data for Bolivia were collected in a Multiple Indicator Cluster Survey (MICS) in 2000. The previous post presented the data on child labor and schooling disaggregated by age group, sex, area of residence, and household wealth. Today's article will take a closer look at the pattern of work and school attendance by age.

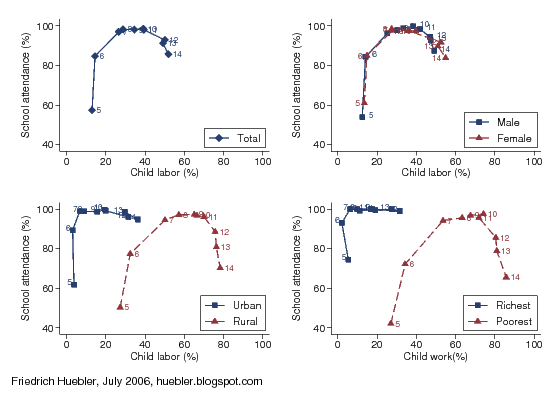
The graph belows present the share of children aged 5 to 14 years who attend school or are engaged in child labor. School attendance is defined as attending any level of education at the time of the MICS survey. Each point represents children of a single age, from 5 years, 6 years, and so on, to 14 years of age. Child labor rates are plotted against the horizontal axis, school attendance rates against the vertical axis.

Child labor and school attendance by age, children 5-14 years, Bolivia
Scatter plot with child labor and school attendance rates by age, Bolivia 2000
Data source: Bolivia 2000 MICS.

The upper left quadrant shows the values for all children combined. The inverted U shape indicates that children work steadily more as they grow older, while school attendance rates reach a peak near 100 percent for children between 7 and 11 years of age and then decrease again. The upper right quadrant, with data disaggregated by gender, makes clear that there is no difference between boys and girls in Bolivia, as far as work and school are concerned.

There are, however, big differences between children from urban and rural areas, as the lower left quadrant shows. Among urban children, school attendance rates rise rapidly with age and at 7 years, 99 percent of all children are in school. Few children drop out as they grow older and among 14-year-olds, the school attendance rate is still 95 percent. In rural areas, school attendance rates for children between 7 and 11 years of age are also above 90 percent.

Compared to urban children, rural children are much more likely to be engaged in child labor. The highest child labor rate in urban areas is observed for children 14 years old (36 percent). In contrast, one third of all 6-year-olds (32 percent) and half of all 7-year-olds (50 percent) do child labor. Child labor rates continue to increase with age and at 14 years, 78 percent of all rural children work, compared to 70 percent in this age group who attend school.

The last graph, in the lower right quadrant, compares children from the richest and poorest 20 percent of all households. The overall pattern is very similar to that for urban and rural children. Children from wealthy households are much more likely to attend school and less likely to work than children from poor households. In the richest household quintile, school attendance rates are between 99 and 100 percent for all children aged 7 to 14 years, while child labor rates do not exceed 32 percent. In the poorest household quintile, the child labor rate reaches 86 percent among 14-year-old children. 66 percent of 14-year-olds from the poorest household are in school.

A comparison of the individual graphs makes clear that the overall pattern of child labor and school attendance in Nepal is strongly influenced by children from poor, rural households. Many of these children work and do not complete their education.

Related articles
Friedrich Huebler, 31 July 2006 (edited 5 October 2008), Creative Commons License
Permanent URL: http://huebler.blogspot.com/2006/07/child-labor-and-school-attendance-in.html

Thursday, June 29, 2006

Child labor and school attendance in Bolivia

Previous posts presented data on primary and secondary school attendance in Bolivia, one of UNICEF's 25 priority countries for girls' education. With a primary school net attendance rate of 76.4 percent, Bolivia is not close to the Millennium Development Goal of a full course of primary schooling for all children by 2015. There are several obstacles on the way to universal primary education and one of these obstacles is child labor.

Child labor can harm a child's health and, even if not harmful, it can interfere with school attendance. The latest data on school attendance for Bolivia comes from a Demographic and Health Survey (DHS) conducted in 2003/04. The DHS did not collect data on work by children but such data is available from a Multiple Indicator Cluster Survey (MICS) that was carried out in 2000.

The graph and table below present the share of children aged 5 to 14 years who attend school or are engaged in child labor. School attendance is defined as attending any level of education at the time of the MICS survey, from preschool over primary to secondary school. Child labor is defined as any economic work during the week of the survey, or more than two hours of domestic work per day. Economic work includes paid or unpaid work for someone who is not a member of the household, and paid or unpaid work for a family farm or business. Domestic work covers activities like cleaning, cooking, shopping, or caring for other children.

School attendance and child labor, children 5-14 years, Bolivia
Bar chart with school attendance and child labor rates in Bolivia, 2000
Data source: Bolivia 2000 MICS.

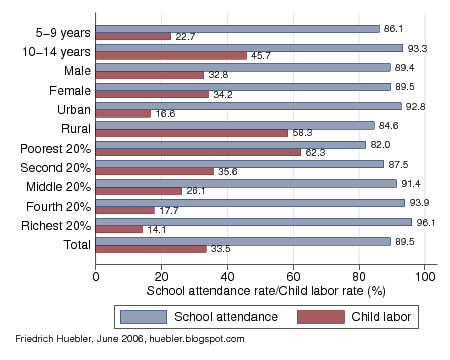
In total, 89.5 percent of all children between 5 and 14 years are in school and 33.5 percent are engaged in child labor. Older children are more likely to go to school or work than younger children. There is no difference between boys' and girls' school attendance rates but slightly more girls are engaged in child labor. There are clear differences between children from urban and rural areas, especially with regard to child labor. 92.8 percent of all urban children go to school and only 16.6 percent are in child labor. In rural areas, 84.6 percent are in school and more than half of all children, 58.3 percent, are child laborers.

There is also a clear association between household wealth and school or work. Of all groups, children from the poorest 20 percent of all households have the lowest school attendance and highest child labor rates: 82.0 percent are in school and 62.3 percent at work. In contrast, children from the richest 20 percent of all households are most likely to be in school and least likely to work: 96.1 percent of these children attend school and only 14.1 are engaged in child labor. School attendance rates increase steadily with household wealth, while child labor rates decrease.

School attendance and child labor, children 5-14 years, Bolivia 2000

School attendance (%)Child labor (%)
5-9 years86.122.7
10-14 years93.345.7
Male89.432.8
Female89.534.2
Urban92.8
16.6
Rural84.658.3
Poorest household quintile82.062.3
Second household quintile87.535.6
Middle household quintile91.426.1
Fourth household quintile93.917.7
Richest household quintile96.114.1
Total89.533.5
Data source: Bolivia 2000 MICS.

Related articles
Friedrich Huebler, 29 June 2006 (edited 5 October 2008), Creative Commons License
Permanent URL: http://huebler.blogspot.com/2006/06/child-labor-and-school-attendance-in.html

Saturday, May 27, 2006

Secondary school attendance in Bolivia

Bolivia is one of UNICEF's 25 priority countries for girls' education. The primary school net attendance rate (NAR) is 76.4 percent, according to results of a Demographic and Health Survey (DHS) from 2003/04. This means that three out of four children of primary school age are in primary school.

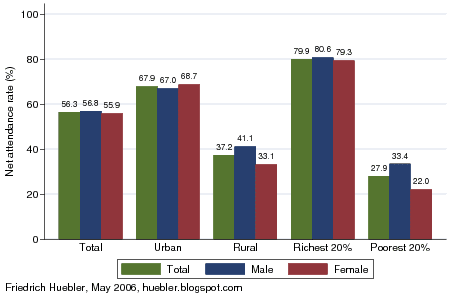
Fewer children continue their education at the secondary level. Overall, the secondary school NAR is 56.3 percent according to the DHS, but attendance rates are much higher in urban areas and among the richest households (see the graph below). In the richest 20 percent of all households, 79.9 percent of all children of secondary school age are in secondary school. In urban areas of Bolivia, the secondary school NAR is 67.9 percent. The lowest attendance rate, 27.9 percent, is observed among the poorest 20 percent of all households. In other words, more than seven out of ten children from the poorest households do not attend secondary school. In rural areas the secondary NAR is 37.2 percent.

Secondary school net attendance rate, Bolivia 2003/04
Bar chart with total, male and female secondary school net attendance rate in Bolivia, 2003/04
Data source: Bolivia 2003/04 DHS.

In Bolivia overall, there is gender parity at the secondary level of education. The gender parity index (GPI), the ratio of the female to the male NAR, is 0.98, as shown in the following table. In primary school, gender parity exists regardless of the area of residence and the level of household wealth, but this is not the case at the secondary level of education. In rural areas and among the poorest households, boys are much more likely to attend secondary school than boys. The GPI in rural areas is 0.81 and among the poorest 20 percent of all households it is as low as 0.66, which means that for every three boys only two girls are in secondary school. To reach the Millennium Development Goal of gender parity at all levels of education, it is necessary to bring more girls from poor and rural households into school.

Secondary school net attendance rate, Bolivia 2003/04

Total
NAR (%)
Male NAR (%)Female NAR (%)Difference
male- female
GPI
female/ male
Urban67.967.068.7-1.71.03
Rural37.241.133.18.00.81
Richest 20%79.980.679.31.30.98
Poorest 20%27.933.422.011.40.66
Total56.356.855.91.00.98
GPI: gender parity index. - Data source: Bolivia 2003/04 DHS.

Related articles
Friedrich Huebler, 27 May 2006 (edited 30 June 2006), Creative Commons License