Showing posts with label publication. Show all posts

Saturday, March 31, 2012

World Atlas of Gender Equality in Education

Cover of the UNESCO gender atlasUNESCO and the UNESCO Institute for Statistics (UIS) have published a new World Atlas of Gender Equality in Education that illustrates the participation of girls and boys in pre-primary, primary, secondary, and tertiary education. The data show that there has been significant progress towards gender parity since the 1970s. Two thirds of all countries have reached gender parity in primary education but at the secondary level of education girls are still lagging behind. In some countries, girls have the advantage with regard to access to and completion of education. At the tertiary level, female students outnumber male students in many high-income countries.

The atlas is divided into eight chapters that contain a total of 28 maps and close to 100 charts and tables:

  1. Increased worldwide demand for quality schooling
  2. Girls’ right to education
  3. Enrolment and gender trends: primary education
  4. Enrolment and gender trends: secondary education
  5. Enrolment and gender trends: tertiary education
  6. Trends in school-life expectancy
  7. Gender trends: adult and youth literacy
  8. How policies affect gender equality in education
An excerpt from Chapter 7 on literacy is shown below. The map (please click the image for a larger view) visualizes adult literacy rates from the database of the UNESCO Institute for Statistics. Among countries with data, literacy rates are lowest in sub-Saharan Africa and South Asia. The highest adult literacy rates are observed in Eastern Europe and Central Asia. For many developed countries, the adult literacy rate is unknown because these countries have achieved universal primary education and no longer report data on the traditional literate-illiterate dichotomy, focusing instead on the more narrowly defined concept of functional literacy.

The atlas is available in English, French and Spanish. In addition, UNESCO and UIS plan to launch an online e-atlas with interactive maps.

Excerpt from World Atlas of Gender Equality in Education: Map with adult literacy rates
World map with adult literacy rates
Source: UNESCO, 2012, World Atlas of Gender Equality in Education, pages 92-93. - Click image to enlarge.

Reference

External links
Related articles
Friedrich Huebler, 31 March 2012, Creative Commons License
Permanent URL: http://huebler.blogspot.com/2012/03/atlas.html

Sunday, October 30, 2011

Global Education Digest 2011

Cover of the Global Education Digest 2010The UNESCO Institute for Statistics (UIS) announced the publication of the Global Education Digest 2011. The focus of this year's edition of the GED is on secondary education.

Growing enrolment in primary education over past decades - partly due to the emphasis on universal primary education by the Millennium Development Goals and Education for All - has led to increased demand for secondary education. The Global Education Digest 2011describes trends in participation in and completion of lower and upper secondary education from 1970 to the present, as well as disparities in access to education of children of secondary school age. The GED also contains analysis of data on educational attainment, technical and vocational education and training, secondary school teachers, and education finance.

The analytical chapter is accompanied by 200 pages of statistical tables on pre-primary, primary, secondary and tertiary education. The GED 2011 introduces several new tables that did not appear in previous editions. Table 5 lists national, regional and global estimates of the number and percent of children of primary and lower secondary school age out of school. Table 19 introduces a new indicator of educational attainment, the percentage of the population 25 years and older with at least completed primary, lower secondary, upper secondary, post-secondary, or tertiary education. All data from the statistical annex will also be available in the UIS Data Centre.

Reference
  • UNESCO Institute for Statistics (UIS). 2011. Global education digest 2011: Comparing education statistics across the world. Montreal: UIS. (Download in PDF format, 7.5 MB)
External links
Related articles
Friedrich Huebler, 30 October 2011 (edited 31 October 2011), Creative Commons License
Permanent URL: http://huebler.blogspot.com/2011/10/ged.html

Friday, September 30, 2011

Adult and youth literacy in 2009

8 September was International Literacy Day. On this occasion, the UNESCO Institute for Statistics (UIS) released a fact sheet with estimates of adult and youth literacy in 2009, the most recent year with data.

The global adult literacy rate, for the population 15 years and older, was 83.7% in 2009, compared to 83.4% in 2008. The adult illiterate population fell from 796.2 million in 2008 to 793.1 million in 2009. 64.1% of the adult illiterate population were women. Adult literacy rates are lowest in sub-Saharan African and in South and West Asia (see Figure 1). In 11 countries, less than half of the adult population were able to read and write: Benin, Burkina Faso, Chad, Ethiopia, Gambia, Guinea, Haiti, Mali, Niger, Senegal and Sierra Leone.

Figure 1: Adult literacy rate, 2009
World map with adult literacy rates in 2009
Source: UNESCO Institute for Statistics, 2011

Youth literacy rates - for the population 15 to 24 years - are generally higher than adult literacy rates, due to increased school attendance rates among younger generations. The global youth literacy rate was 89.3% in 2009, compared to 89.0% in 2008. The youth illiterate population fell from 130.6 million in 2008 to 127.3 million in 2009. Youth literacy rates are lowest in sub-Saharan Africa (see Figure 2) and the five countries worldwide with youth literacy rates below 50% are from this region: Burkina Faso, Chad, Ethiopia, Mali and Niger.

Figure 2: Youth literacy rate, 2009
World map with youth literacy rates in 2009
Source: UNESCO Institute for Statistics, 2011

Reference
  • UNESCO Institute for Statistics (UIS). 2011. Adult and youth literacy. UIS fact sheet no. 16, September. Montreal: UIS. (Download in PDF format, 350 KB)
Related articles
External links
Friedrich Huebler, 30 September 2011, Creative Commons License
Permanent URL: http://huebler.blogspot.com/2011/09/literacy.html

Tuesday, May 31, 2011

Education finance in sub-Saharan Africa

Cover of the UIS education finance reportA new report by the UNESCO Institute for Statistics, Financing education in sub-Saharan Africa, presents comprehensive data for the past decade for 45 African countries.

The number of children enrolled in primary school in sub-Saharan Africa grew from 87 million in 2000 to 129 million in 2008, an increase of 48 percent. Over the 1999-2009 decade, real public expenditure on education, adjusted for inflation, grew on average by 6.1 percent per year, based on data from 26 countries. The highest annual growth rates of education spending in sub-Saharan Africa, over 12 percent, were observed in Mozambique and Burundi. Of the countries with data, only the Central African Republic experienced a decline in public expenditure on education.

The countries of sub-Saharan Africa combined spend 5.0 percent of their GDP on education, the second highest value of the eight EFA regions, after North America and Western Europe, where 5.3 percent of the regional GDP is spent on the education sector.

The figure below shows data on education expenditure in 28 countries in sub-Saharan Africa. The horizontal axis indicates a country's total public expenditure as a percentage of gross domestic product (GDP). The vertical axis indicates a country's total public expenditure on education as a percentage of total public expenditure. Total public expenditure on education as a percentage of GDP can be calculated as the product of the two values plotted along the vertical and horizontal axes.

Public education expenditure / GDP =
(Public education expenditure / Total public expenditure) × (Total public expenditure / GDP)

The three curves in the graph indicate where total public expenditure on education is equal to 2, 5 or 10 percent of GDP. Countries with higher expenditures on education as a percentage of GDP are found near the upper right corner of the graph, countries with lower expenditures near the lower left corner. For the countries in the graph, public expenditure on education as a percentage of GDP ranges from 1.3 percent in the Central Africal Republic to 12.4 percent in Lesotho.

Total public expenditure on education as a percentage of total public expenditure in relation to total public expenditure as a percentage of GDP
Scatter plot with education finance data for 28 countries in sub-Saharan Africa
Source: UIS 2011, page 30, Figure 11

Reference
  • UNESCO Institute for Statistics (UIS). 2011. Financing education in sub-Saharan Africa: Meeting the challenges of expansion, equity and quality. Montreal: UIS. (Download in PDF format, 8.7 MB)
External links
Related articles
Friedrich Huebler, 31 May 2011 (edited 1 June 2011), Creative Commons License
Permanent URL: http://huebler.blogspot.com/2011/05/ssa.html

Sunday, March 6, 2011

EFA Global Monitoring Report 2011

Cover of the EFA Global Monitoring Report 2011The Education for All Global Monitoring Report 2011 was released by UNESCO on 1 March 2011. This year's edition of this annual report has the title The hidden crisis: Armed conflict and education. The report documents the impact of violent conflict on education and the long-lasting negative effects on educational attainment and literacy.

Today, 28 million or over 40 percent of all children out of school (67 million worldwide) live in countries affected by conflict, although these countries are home to only 116 million or 18 percent of the global population of primary school age (653 million) (see Figure 1). (Only out-of-school children in low and lower-middle income conflict-affected countries were counted to arrive at the total of 28 million. In addition, for large countries like India, Indonesia, Nigeria and Pakistan, only children living in conflict-affected areas were included in the 28 million children affected by conflict.) In conflict areas, the out-of-school rate is around 24 percent, compared to 7 percent in other parts of the world. Children affected by armed conflict are thus more than three times as likely to be out of school as other children.

Conflict-affected countries also have some of the lowest levels of literacy. In these countries, only 79 percent of youth between 15 and 24 years and 69 percent of adults are literate, compared to 93 percent of youth and 85 percent of adults in other countries.

War does not only destroy lives and schools, it also diverts resources from education to military spending. The Global Monitoring Report documents how lack of access to education or exposure to the wrong kind of education can contribute to persistent inequality, prejudice and renewed armed conflict, a vicious cycle that is difficult to break.

Lastly, the Global Monitoring Report 2011 examines the role of development assistance in conflict-affected countries and argues for increased and more effective aid for the education sector.

Figure 1: Population of primary school age and children out of school in countries affected and not affected by armed conflict, 2008
Pie chart with data on children in conflict and non-conflict countries
Source: UNESCO 2011, pages 132, 308, 309; author's calculations.

Reference
  • UNESCO. 2011. EFA Global Monitoring Report 2011: The hidden crisis: Armed conflict and education. Paris: UNESCO. (Download in PDF format, 6.4 MB)
External links
Related articles
Friedrich Huebler, 6 March 2011 (edited 26 March 2011), Creative Commons License
Permanent URL: http://huebler.blogspot.com/2011/03/gmr.html

Sunday, October 31, 2010

UN Millennium Development Goals Report 2010

Cover of the Millennium Development Goals Report 2010On 20-22 September 2010, world leaders met at the United Nations in New York on the occasion of the 10-year anniversary of the Millennium Summit of 2000. One outcome of the 2000 Summit was the adoption of eight Millennium Development Goals (MDGs).
  1. Eradicate extreme poverty and hunger
  2. Achieve universal primary education
  3. Promote gender equality and empower women
  4. Reduce child mortality
  5. Improve maternal health
  6. Combat HIV/AIDS, malaria and other diseases
  7. Ensure environmental sustainability
  8. Develop a global partnership for development
Progress toward the MDGs is documented in the annual Millennium Development Goals Report by the United Nations. The 2010 report contains statistics and analysis for each of the eight goals. For the goal of universal primary education by 2015, "hope dims" according to the report. Although enrollment rates continue to grow worldwide, 69 million children of primary school age were still out of school in 2008, the most recent year with data. Almost three quarters of all out-of-school children lived in two regions: sub-Saharan Africa (31 million) and Southern Asia (18 million).

Reference
  • United Nations. 2010. The millennium development goals report 2010. New York: United Nations. (Download PDF, 8.5 MB)
External linksRelated articles
Friedrich Huebler, 31 October 2010, Creative Commons License
Permanent URL: http://huebler.blogspot.com/2010/10/mdg.html

Sunday, September 19, 2010

Global Education Digest 2010

Cover of the Global Education Digest 2010On 17 September, the UNESCO Institute for Statistics (UIS) announced the publication of the Global Education Digest 2010. This year's edition of the GED focuses on gender and education.

The Millennium Development Goals (MDGs) call for the elimination of gender disparity at all levels of education by 2015 but according to the GED, only 85 of 157 countries with data will have reached gender parity in primary and secondary education by 2015, if current trends continue. 23 countries are unlikely to reach the goal at the primary level and 63 countries are unlikely to do so at the secondary level.

Gender disparities in access to education are greatest in sub-Saharan Africa, South and West Asia, and to a lesser extent in the Arab States. In these regions, fewer girls than boys are enrolled in primary, secondary and tertiary education. The opposite - gender disparity in favor of girls - can be observed in tertiary education in Central and Eastern Europe, Central Asia, Latin America and the Caribbean, and North America and Western Europe.

Other topics discussed in the Global Education Digest 2010 include: the differences between boys and girls in terms of progression through and completion of primary and secondary education; the interaction between gender, socio-economic status, geographic location, ethnicity and other factors as determinants of participation in education; differences in learning achievement of boys and girls; trends in adult literacy; women's choice of field of study at the tertiary level of education; and national education policies.

The statistical tables in the GED were updated with data up to 2008 for most indicators. All data are also available at the UIS Data Centre.

Reference
  • UNESCO Institute for Statistics (UIS). 2010. Global education digest 2010: Comparing education statistics across the world. Montreal: UIS. (Download in PDF format, 8 MB)
External links
Related articles
Friedrich Huebler, 19 September 2010 (edited 20 September 2010), Creative Commons License
Permanent URL: http://huebler.blogspot.com/2010/09/ged.html

Sunday, March 28, 2010

Children of primary and secondary school age out of school

The UNESCO Institute for Statistics (UIS) publishes annual estimates of the number of children of primary school age out of school. A recent paper by Michael Bruneforth and Peter Wallet, Out-of-school adolescents (UIS 2010), extends the analysis to children of lower secondary school age. Any child enrolled in primary, secondary or tertiary education is considered in school, regardless of the child's age. Only children that are truly excluded from education are counted as out of school.

The paper's regional and global estimates of the number and percent of children out of school are reproduced in this article. Table 1 lists the population of primary and lower secondary school age in 2007. Worldwide there were about 653 million children of primary school age and 388 million children of lower secondary school age. More than half of these children lived in South and West Asia and East Asia and the Pacific.

Table 1: Population of primary and lower secondary school age by region (million), 2007
Region Primary Lower secondary Total
Sub-Saharan Africa 124.9 57.9 182.7
Arab States 41.4 21.9 63.5
South and West Asia 176.8 106.8 284.2
Central Asia 5.6 8.0 13.8
East Asia and the Pacific 173.8 106.5 281.2
Central and Eastern Europe 22.2 20.3 42.1
North America and Western Europe 50.8 31.0 81.6
Latin America and the Caribbean 58.6 35.9 93.7
World 652.6 388.2 1042.5
Source: UIS 2010, page 10, Table 1; author's calculations. - Note: Figures may not sum due to rounding.

Figure 1 illustrates the regional distribution of the population of primary and lower secondary school age. The number of children in these age groups is plotted along the horizontal axis. The vertical axis indicates the share of children of primary and lower secondary school age in each region. The regions with the largest number of school-age children in 2007 were South and West Asia (284 million), East Asia and the Pacific (281 million), and Sub-Saharan Africa (183 million). More than 60 percent of the combined population of primary and lower secondary school age were of primary school age. Central Asia and Central and Eastern Europe were exceptions, with a greater share of children of lower secondary school age than in other regions. The large share of primary-age children in Sub-Saharan Africa is a symptom of its high population growth rate.

Figure 1: Population of primary and lower secondary school age by region, 2007
Spine plot showing the distribution of the population of primary and lower secondary school age by region in 2007
Source: UIS 2010, page 10, Table 1; author's calculations. - CEE: Central and Eastern Europe, NAWE: North America and Western Europe, LAC: Latin America and the Caribbean.

The share and number of children out of school are listed in Table 2. At the global level, 11 percent or 72 million of all children of primary school age and 18 percent or 71 million of all children of lower secondary school age were out of school. The combined global share of children out of school was 14 percent. Out-of-school rates were highest in Sub-Saharan Africa, where 26 percent of all primary school-age children and 37 percent of all secondary school-age children were excluded from education.

Table 2: Children of primary and lower secondary school age out of school by region, 2007
Region Primary Lower secondary Total
Percent Million Percent Million Percent Million
Sub-Saharan Africa 25.8 32.2 36.8 21.3 29.3 53.5
Arab States 13.9 5.8 19.5 4.3 15.8 10.0
South and West Asia 10.2 18.0 27.3 29.1 16.6 47.2
Central Asia 4.8 0.3 4.9 0.4 4.8 0.7
East Asia and the Pacific 5.2 9.0 10.0 10.6 7.0 19.7
Central and Eastern Europe 7.0 1.6 9.6 1.9 8.3 3.5
North America and Western Europe 3.8 1.9 4.3 1.3 4.0 3.3
Latin America and the Caribbean 5.1 3.0 5.5 2.0 5.3 5.0
World 11.0 71.8 18.3 71.0 13.7 142.8
Source: UIS 2010, page 10, Table 1.

As illustrated in Figure 2, out-of-school rates are always higher at the secondary level of education than at the primary level. This is not surprising because not all students complete primary education and not all of those who graduate from primary school transfer to secondary school to continue their education. In addition to Sub-Saharan Africa, South and West Asia (27 percent) and the Arab States (20 percent) also had a high share of children of secondary school age out of school.

Figure 2: Children of primary and lower secondary school age out of school by region, 2007
Bar chart showing the share of children of primary and lower secondary school age out of school by region in 2007
Source: UIS 2010, page 10, Table 1.

The distribution of children out of school by region in 2007 is shown in Figure 3. A comparison with the population distribution in Figure 1 makes clear that children from Sub-Saharan Africa and South and West Asia were disproportionately more likely to be out of school than children from other regions. More than two thirds of the 143 million out-of-school children of primary and lower secondary age were from Sub-Saharan Africa (54 million) and South and West Asia (47 million). 20 million children out of school lived in East Asia and 10 million in the Arab States. The remaining 13 million children out of school were from Latin America and the Caribbean (5 million), Central and Eastern Europe (3.5 million), North America and Western Europe (3.3 million), and Central Asia (0.7 million).

Figure 3: Children of primary and lower secondary school age out of school by region, 2007
Spine plot showing the distribution of children of primary and lower secondary school age out of school by region in 2007
Source: UIS 2010, page 10, Table 1. - CEE: Central and Eastern Europe, NAWE: North America and Western Europe, LAC: Latin America and the Caribbean.

In Sub-Saharan Africa, the Arab States, North America and Western Europe, and Latin America and the Caribbean most children out of school were of primary age. In South and West Asia, East Asia, and Central and Eastern Europe most children out of school were of lower secondary age. At the global level, the number of out-of-school children of primary school age and lower secondary school age was roughly equal (see Table 2).

References
Related articles
External links
Friedrich Huebler, 28 March 2010 (edited 17 August 2011), Creative Commons License
Permanent URL: http://huebler.blogspot.com/2010/03/coos.html

Sunday, January 31, 2010

EFA Global Monitoring Report 2010

Cover of the EFA Global Monitoring Report 2010The Education for All Global Monitoring Report 2010 was released on 19 January 2010. The Global Monitoring Report is written annually by an independent team and published by UNESCO.

The title of this year's report is Reaching the marginalized. UNESCO estimates that 72 million children of primary school age were out of school in 2007. The report examines who these children are and why they are excluded from education. The report further argues that there is a persistent financing gap that prevents countries from reaching the goal of education for all and that, based on current trends, 56 million children of primary school age will still be out of school in 2015.

The report introduces a new database on Deprivation and Marginalization in Education that was developed by the EFA Global Monitoring Report team and the Department of Economics at the University of Göttingen. The DME database introduces a measure of "education poverty", defined as the share of the population aged 17 to 22 years with less than 4 years or less than 2 years in school. Data are presented as global snapshots and in individual country profiles. All statistics were calculated with data from Demographic and Health Surveys (DHS) and Multiple Indicator Cluster Surveys (MICS).

Excerpt from Nigeria country overview in DME database
Graph with education disparity data from Nigeria
Source: Deprivation and Marginalization in Education database, country overviews.

Reference
  • UNESCO. 2010. EFA Global Monitoring Report 2010: Reaching the marginalized. Paris: UNESCO. (Download in PDF format, 12 MB)
External links
Related articles
Friedrich Huebler, 31 January 2010 (edited 7 March 2011), Creative Commons License
Permanent URL: http://huebler.blogspot.com/2010/01/gmr.html

Friday, July 31, 2009

Global Education Digest 2009

Cover of "The State of the World's Children 2009"The UNESCO Institute for Statistics (UIS) has published the 2009 edition of its annual Global Education Digest. The GED presents the latest statistics on pre-primary, primary, secondary and tertiary education, education finance, literacy and educational attainment. The statistical tables contain data for more than 200 countries and territories. In addition to national data, the tables offer global values and regional values for the Arab States, Central and Eastern Europe, Central Asia, East Asia and the Pacific, Latin America and the Caribbean, North America and Western Europe, South and West Asia, and Sub-Saharan Africa.

The analytical chapter that precedes the statistical tables is dedicated to a different topic every year. The analytical chapter in the GED 2009 explores global trends in higher education, including levels of participation, fields of study, student mobility, and tertiary education finance. The tables with time series data from 1970 to 2005 that were introduced in the previous GED are limited to data on tertiary education this year. The GED 2008 also contained time series tables on primary and secondary education.

The data from the GED are available free of charge at the UIS Data Centre. To access the statistical tables, click on "Predefined Tables" and then "Education". For most indicators, the GED only lists data for one or two years, whereas the Data Centre provides annual statistics from 1999 to 2008. The Data Centre also offers time series data for selected primary, secondary and tertiary education indicators from 1970 to 2005.

References
  • UNESCO Institute for Statistics (UIS). 2009. Global education digest 2009: Comparing education statistics across the world. Montreal: UIS. (Download PDF, 7.0 MB)
  • UNESCO Institute for Statistics (UIS). 2008. Global education digest 2008: Comparing education statistics across the world. Montreal: UIS. (Download PDF, 6.3 MB)
External links
Related articles
Friedrich Huebler, 31 July 2009 (edited 19 September 2010), Creative Commons License
Permanent URL: http://huebler.blogspot.com/2009/07/ged.html

Sunday, February 1, 2009

The State of the World's Children 2009

Cover of "The State of the World's Children 2009"The 2009 edition of The State of the World's Children was released by UNICEF in January. The main theme of this year's report is maternal and newborn health. Women in developing countries are at a much higher risk of dying from complications during pregnancy or delivery than women in developed countries. For example, the lifetime risk of maternal death is 1 in 7 in Niger and 1 in 17400 in Sweden.

The statistical annex to The State of the World's Children contains tables with national, regional and global data on nutrition, health, HIV and AIDS, education, demography, economy, women, and child protection. In the area of education, the annex lists data for the following indicators:
  • Primary school enrollment and attendance rate
  • Secondary school enrollment and attendance rate
  • Survival rate to the last grade of primary school
  • Youth and adult literacy rate
The survival rate to the last grade of primary school replaced the survival rate to grade 5 that was reported in previous years. This change was made to match the official list of Millennium Development Goal indicators, in which the survival rate to grade 5 was replaced by the survival rate to the last grade as a new indicator for MDG 2, universal primary education by 2015.

The publication of The State of the World's Children was accompanied by an update of UNICEF's Childinfo website, where additional data and analysis can be found. For example, the education section of the Childinfo site lists new national estimates for the number of children out of school, among other statistics.

External links
Related articles
Friedrich Huebler, 1 February 2009, Creative Commons License
Permanent URL: http://huebler.blogspot.com/2009/02/sowc.html

Sunday, December 28, 2008

Global Education Digest 2008

Cover of the Global Education Digest 2008The UNESCO Institute for Statistics (UIS) has announced the publication of the Global Education Digest 2008: Comparing Education Statistics Across the World. This annual publication contains detailed statistical tables with the latest UIS data on pre-primary, primary, secondary and tertiary education, education finance and literacy.

The introductory chapters in the this year's edition of the Digest discuss the data collection process at UIS, the International Standard Classification of Education (ISCED) and differences between national and international education data, the use of historical time series to track educational trends, and programs of cooperation between UIS and the Organisation for Economic Co-operation and Development (OECD) and the Statistical Office of the European Communities (Eurostat).

The Global Education Digest 2008 contains several tables that were not available in the 2007 edition. New tables with time series data provide statistics for more than 200 countries and territories from 1970, 1980, 1990, 2000 and 2005 for the following indicators: primary and secondary school age; population of secondary school age (the population of primary school age is available at the UIS Data Centre, see below); enrollment in primary, secondary and post-secondary education; total enrollment from primary to tertiary education; primary and secondary school gross enrollment ratio (GER); primary school gross intake ratio; gross intake ratio to the last grade of primary school (a proxy indicator for the primary completion rate); repetition rate in primary and secondary school; school life expectancy (primary to secondary and primary to tertiary); pupil/teacher ratio in primary and secondary school; and public expenditure on education.

A further addition in the new publication is a set of tables with data for 62 UOE and WEI countries. UOE refers to a joint data collection program by UIS, OECD and Eurostat in high- and middle-income countries. WEI stands for World Education Indicators, a UIS program for middle-income countries. The participating countries are listed on pages 30 and 31 of the Global Education Digest 2008.

The data from the tables in the Global Education Digest can be downloaded from the UIS Data Centre (click on "Predefined Tables" and then "Education"). The time series data for the years 1970 to 2005 are available in Excel format in Tables 21 to 23. The population of primary school age between 1970 and 2005 is not shown in the printed report but included in Table 21. In addition, the Data Centre offers annual data for the years 1999 to 2008, while the Digest only shows data for one or two years, depending on the indicator.

References
  • UNESCO Institute for Statistics (UIS). 2008. Global education digest 2008: Comparing education statistics across the world. Montreal: UIS. (Download PDF, 7.3 MB)
  • UNESCO Institute for Statistics (UIS). 2007. Global education digest 2007: Comparing education statistics across the world. Montreal: UIS. (Download PDF, 3.7 MB)
External links
Related articles
Friedrich Huebler, 28 December 2008 (edited 31 July 2009), Creative Commons License
Permanent URL: http://huebler.blogspot.com/2008/12/ged.html

Monday, December 8, 2008

EFA Global Monitoring Report 2009

Cover of the EFA Global Monitoring Report 2009UNESCO released the 2009 edition of the Education for All Global Monitoring Report 2009 on 25 November 2008. The title of this year's report is Overcoming inequality: Why governance matters.

The report emphasizes the responsibility of governments across the world to tackle persistent inequalities in education - linked to wealth, gender, ethnicity, area of residence, and other factors - that threaten the Millennium Development Goal of universal primary education. According to projections by UNESCO, at least 29 million children of primary school age will still be out of school in 2015. Many children who attend school fail to reach basic literacy and numeracy. A lack of education among disadvantaged groups contributes to persistent poverty, increased child mortality, and slower economic growth.

The EFA Global Monitoring Report 2009 and related material are available at the EFA website of UNESCO.

References
  • UNESCO. 2008. EFA Global Monitoring Report 2009 - Overcoming inequality: Why governance matters. Paris: UNESCO. (Download in PDF format, 9.2 MB)
External links
Related articles
Friedrich Huebler, 8 December 2008, Creative Commons License
Permanent URL: http://huebler.blogspot.com/2008/12/efa.html

Sunday, November 23, 2008

Multiple Indicator Cluster Survey blog

Screenshot of the "MICS For All" blogThe Multiple Indicator Cluster Surveys (MICS) are household surveys carried out in developing countries with the support of UNICEF to collect data on the situation of children and women. The most recent round of MICS surveys was conducted between 2005 and 2007 in more than 40 countries. MICS data and documentation are available at the Childinfo website of UNICEF.

MICS surveys are among the sources of data analyzed on this site. MICS data were used in articles on trends in primary education in Nepal, children out of school in India, child labor and school attendance in Bolivia, education disparity trends in South Asia, global data on child labor and school attendance, household wealth and years of education, the link between years of schooling and literacy, and other studies.

UNICEF staff members working on the MICS have launched a new blog at globalmics.blogspot.com. The goal of the blog is "to facilitate information sharing between different organizations and individuals involved with MICS implementation around the world" and "to play the role of an unofficial, informal forum to share information on MICS activities." Articles posted since the launch have treated a variety of topics, among them acronyms and abbreviations related to MICS, members of the global MICS team, and the evaluation of the latest round of MICS.

External links
Related articles
Friedrich Huebler, 23 November 2008, Creative Commons License
Permanent URL: http://huebler.blogspot.com/2008/11/mics.html

Friday, October 17, 2008

UN Millennium Development Goals Report 2008

Cover of UN MDG Report 2008In August 2008, the United Nations published the latest edition of its annual report on progress toward the Millennium Development Goals (MDG). The Millennium Development Goals Report 2008 presents data for each of the eight MDGs.
  1. Eradicate extreme poverty and hunger
  2. Achieve universal primary education
  3. Promote gender equality and empower women
  4. Reduce child mortality
  5. Improve maternal health
  6. Combat HIV/AIDS, malaria and other diseases
  7. Ensure environmental sustainability
  8. Develop a global partnership for development
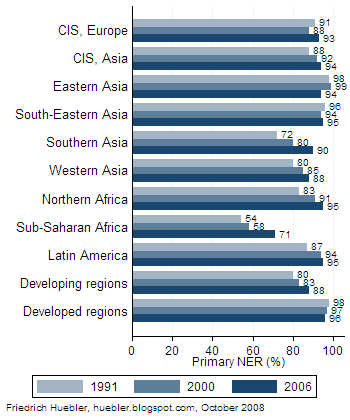
In the section on MDG 2, universal primary education, trends in primary school enrollment from 1991 to 2006 are shown for each MDG region. One region, the Commonwealth of Independent States, is further divided into countries in Europe and Asia. No data are provided for the Oceania region.

Primary school net enrollment rate, 1991-2006
Bar graph with regional primary school net enrollment rates from 1991 to 2006
Source: United Nations, The Millennium Development Goals Report 2008, page 12.

Six MDG regions have reached primary school net enrollment rates at or above 90 percent: Commonwealth of Independent States (Europe and Asia), Eastern Asia, South-Eastern Asia, Southern Asia, Northern Africa, and Latin America. Western Asia is slightly behind with a primary NER of 88 percent. In absolute terms, Sub-Saharan Africa has made the most progress since the turn of the millennium, with a 13 percent increase in the primary NER from 58 percent in 2000 to 71 percent in 2006. This increase was achieved in spite of strong growth in the population of primary school age. Still, three out of ten children of primary school age in Sub-Saharan Africa are not enrolled in primary school. In all developing regions combined, the primary NER rose from 80 percent in 1991 to 88 percent in 2006. In contrast, the primary NER in the developed regions declined from 98 percent in 1991 to 96 percent in 2006.

References
  • United Nations. 2008. The millennium development goals report 2008. New York: United Nations. (Download PDF document, 3.3 MB)
Related articles
External links
Friedrich Huebler, 17 October 2008, Creative Commons License
Permanent URL: http://huebler.blogspot.com/2008/10/mdg-report.html

Sunday, October 12, 2008

Education disparity in South Asia

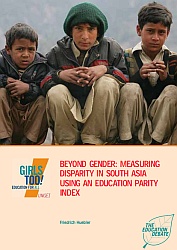
Cover of "Beyond gender: Measuring disparity in South Asia using an education parity index" by Friedrich HueblerA new publication by Friedrich Huebler describes education disparity in the countries of South Asia. The report Beyond gender: Measuring disparity in South Asia using an education parity index was published by the UNICEF regional office for South Asia in its series of papers on girls' education.

Analysis of disparities in national education systems is often limited to gender although other dimensions of disparity are also important. The publication presents data on disparity in primary and secondary education by gender, area of residence and household wealth for countries in South Asia.

To facilitate the interpretation of complex data a newly developed Education Parity Index is introduced. The EPI combines information on disparities across different education indicators and across different groups of disaggregation. This distinguishes the EPI from existing indicators of disparity in education, including the gender parity index and the EFA development index. The EPI is flexible and can be modified according to national priorities, for example by including information on disparities between different ethnic groups.

The use of the EPI as a tool to assess education disparities is illustrated with household survey data from Afghanistan, Bangladesh, India, Nepal and Pakistan. For each country, the report describes how the EPI is calculated. In addition, national trends in education disparity from 1996 to 2006 are presented.

References
  • Huebler, Friedrich. 2008. Beyond gender: Measuring disparity in South Asia using an education parity index. Kathmandu: UNICEF. (Download PDF document, 194 KB)
External links
Related articles
Friedrich Huebler, 12 October 2008 (edited 30 January 2009), Creative Commons License
Permanent URL: http://huebler.blogspot.com/2008/10/epi.html

Sunday, July 27, 2008

A view inside primary schools

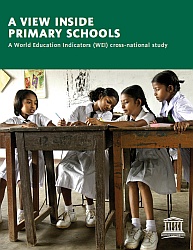
Cover of "A view inside primary schools" by UISA new publication by the UNESCO Institute for Statistics, A view inside primary schools: A World Education Indicators (WEI) cross-national study, presents new data on quality and equality in primary education. The data is from 11 countries in Asia, Latin America, and North Africa that participated in the Survey of Primary Schools by the World Education Indicators Programme in 2005 and 2006. For the survey, fourth grade teachers and principals from over 7,600 schools responded to questions about teaching and learning conditions.

The countries in the study - Argentina, Brazil, Chile, India, Malaysia, Paraguay, Peru, Philippines, Sri Lanka, Tunisia, and Uruguay - are close to the Millennium Development Goal of universal primary education. However, the survey reveals large resource gaps between schools in urban and rural areas. Children in poorly equipped and maintained schools often come from poor families and these children are thus doubly disadvantaged.

Other findings of the survey include:
  • In Paraguay, the Philippines, and Sri Lanka, more than one in five pupils attended schools without running water.
  • In India, Paraguay, Peru, the Philippines, Sri Lanka, and Tunisia, less than half of all pupils were in schools with a telephone.
  • Sri Lanka was the only country participating in the survey that provided free textbooks to virtually all pupils.
  • The overall weekly teaching load for Grade 4 teachers working in only one school ranged from 14 hours in Malaysia to 31 hours in Chile and the Philippines. The average teaching load was 23 hours per week.
  • In all countries in the survey - except in India, Malaysia, and Sri Lanka - most teachers expressed low levels of satisfaction with their salaries.
The full report, with detailed tables and figures, is available for download at the UIS website.

External links
Related articles
Friedrich Huebler, 27 July 2008 (edited 26 October 2008), Creative Commons License
Permanent URL: http://huebler.blogspot.com/2008/07/primary-schools.html

Sunday, January 27, 2008

The State of the World's Children 2008 by UNICEF

Cover of The State of the World's Children 2008 by UNICEFUNICEF released the 2008 edition of its annual publication The State of the World's Children on 22 January 2008. This year's report is dedicated to child survival and primary health care for children and their mothers.
In 2006, 9.7 million children died before they reached their fifth birthday. In spite of improvements in the area of child survival, the world is not on track to reach the Millennium Development Goal of reducing the rate of child mortality by two thirds between 1990 and 2015.

The State of the World's Children contains statistical tables with national data on nutrition, health, HIV and AIDS, education, demography, economy, women, and child protection. In the area of education, the report lists data for the following indicators:
  • Primary school enrollment and attendance
  • Secondary school enrollment and attendance
  • Survival rate to grade 5
  • Youth and adult literacy
The tables in The State of the World's Children complement the statistical review Progress for Children that was released by UNICEF in December 2007.

External links
Related articles
Friedrich Huebler, 27 January 2008 (edited 1 February 2009), Creative Commons License
Permanent URL: http://huebler.blogspot.com/2008/01/state-of-worlds-children-2008-by-unicef.html

Saturday, December 15, 2007

UNICEF statistical review: Progress for Children

Cover of "Progress for Children: A World Fit for Children Statistical Review" by UNICEFOn 10 December 2007, UNICEF launched a new publication, Progress for Children: A World Fit for Children Statistical Review. With more than 60 pages of graphs and tables, the report draws a detailed statistical picture of the current state of the world's children. The publication is divided into sections organized by Millennium Development Goal.
  • MDG 1: Eradicate extreme poverty and hunger
  • MDG 2: Achieve universal primary education
  • MDG 3: Promote gender equality and empower women
  • MDG 4: Reduce child mortality
  • MDG 5: Improve maternal health
  • MDG 6: Combat HIV and AIDS, malaria and other diseases
  • MDG 7: Ensure environmental sustainability
An additional section has data on protection against abuse, exploitation, and violence.

Some findings of the report in the area of education are:
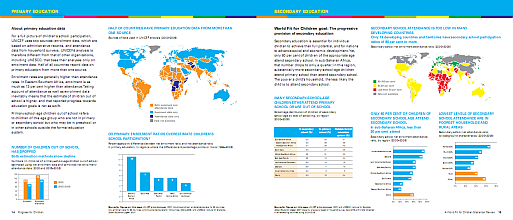
  • The number of children out of school has fallen from 115 million in 2002 to 93 million in 2005-2006.
  • More than three quarters of all children out of school worldwide live in Sub-Saharan Africa and South Asia.
  • Secondary school net attendance or enrollment rates are below 50 percent in many countries, including most of Africa.
  • Almost all countries in North and South America, Europe, Central Asia, and East Asia have reached the goal of gender parity in primary education.
  • Few countries have reached gender parity in secondary education.
  • Child labor, which interferes with education, is most prevalent in Sub-Saharan Africa.
Excerpt from Progress for Children: Data on primary and secondary education
Excerpt from "Progress for Children" by UNICEF: data on primary and secondary education
Source: UNICEF 2007: p. 14-15.

References
  • UNICEF. 2007. Progress for Children: A World Fit for Children Statistical Review. New York: UNICEF. (Download in PDF format, 3.6 MB)
Related articles
External links
Friedrich Huebler, 15 December 2007, Creative Commons License
Permanent URL: http://huebler.blogspot.com/2007/12/unicef-statistical-review-progress-for.html

Monday, December 3, 2007

EFA Global Monitoring Report 2008

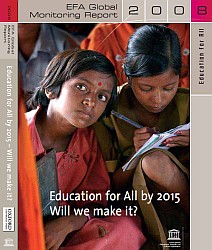
Cover of the Education for All Global Monitoring Report 2008 by UNESCOOn 29 November 2007, UNESCO released the 2008 edition of the annual Education for All Global Monitoring Report, with the title Education for All by 2015: Will we make it? The report, now in its sixth edition, monitors progress towards the six Education for All goals adopted at the World Education Forum in Dakar, Senegal in 2000:
  1. Expand and improve early childhood care and education.
  2. Provide free and compulsory universal primary education by 2015.
  3. Equitable access to learning and life-skills programs.
  4. Achieve a 50% improvement in adult literacy rates.
  5. Eliminate gender disparities in primary and secondary education by 2005 and at all levels by 2015.
  6. Improve all aspects of the quality of education.
Some highlights of the 2008 report are:
  • Between 1999 and 2005, primary school enrollment rose from 647 million to 688 million worldwide. The rate of increase was particularly high in Sub-Saharan Africa and in South and West Asia. As a result, the global number of children out of school fell from 96 million in 1999 to 72 million in 2005.
  • Projections based on current trends show that more than 50 countries will not achieve universal primary education by 2015.
  • One third of all countries missed the goal of gender parity in primary education by 2005. Two thirds of all countries missed the goal of gender parity in secondary education. According to projections, more than 90 countries will not reach gender parity in primary and secondary education by 2015.
  • Fourteen countries abolished primary school fees since 2000 but the cost of schooling remains an obstacle for millions of children.
  • The emphasis by the international community on primary education has come at the expense of early childhood education and literacy programs for youth and adults.
  • One in five adults lacks basic literacy skills. Women account for two thirds of all illiterate adults worldwide. Three quarters of all countries for which projections were calculated will miss the goal of halving adult illiteracy rates by 2015.
The EFA Global Monitoring Report offers a great amount of data and statistical analysis. An annex contains more than 140 pages of statistical tables with national, regional and global data up to the year 2005.

References
  • UNESCO. 2007. Education for all by 2015: Will we make it? - EFA global monitoring report 2008. Paris: UNESCO. (Download in PDF format, 11.8 MB)
Related articles
External links
Friedrich Huebler, 3 December 2007 (edited 8 December 2008), Creative Commons License
Permanent URL: http://huebler.blogspot.com/2007/12/efa-global-monitoring-report-2008.html