Showing posts with label Asia. Show all posts

Tuesday, November 30, 2010

Children out of school: Global trend 1999-2008

68 million children of primary school age were out of school in 2008 according to estimates by the UNESCO Institute for Statistics (UIS). Compared to 1999, when 106 million children were out of school, this is a decrease of over 38 million (see Figure 1). However, in spite of the observed progress over the last decade, the Millennium Development Goal of universal primary education by 2015 will not be reached if current trends continue unchanged.

Figure 1: Children of primary school age out of school, 1999-2008
Bar chart with global number of children out of school from 1999 to 2008
Source: UNESCO Institute for Statistics, Data Centre, November 2010.

The UIS also publishes data on the regional distribution of children out of school, but complete data are only available until 2007. 43 percent - 30.4 million - of all children out of school in 2007 lived in sub-Saharan Africa (see Figure 2). A further 25 percent - 17.7 million - lived in South and West Asia. These two regions combined accounted for two thirds of the global out-of-school population. The shares of the remaining regions were as follows: 13 percent of all children out of school lived in East Asia and the Pacific, 9 percent in the Arab States, 4 percent in Latin America and the Caribbean, 3 percent in North America and Western Europe, 2 percent in Central and Eastern Europe, and less than 1 percent in Central Asia.

Figure 2: Regional distribution of children out of school, 2007
Pie chart with regional distribution of children out of school in 2007
Source: UNESCO Institute for Statistics, Data Centre, November 2010.

Regional and global estimates of the number of children out of school can be obtained from the UIS Data Centre. On the main Data Centre page at stats.uis.unesco.org, click on Predefined Tables and then Education. Table 20H, "Regional sum of primary school age children out of school", lists the total, male and female number of children of primary school age out of school for the period 1999 to 2008.

Related articles
External links
Friedrich Huebler, 30 November 2010 (edited 17 December 2010), Creative Commons License
Permanent URL: http://huebler.blogspot.com/2010/11/oos.html

Sunday, March 28, 2010

Children of primary and secondary school age out of school

The UNESCO Institute for Statistics (UIS) publishes annual estimates of the number of children of primary school age out of school. A recent paper by Michael Bruneforth and Peter Wallet, Out-of-school adolescents (UIS 2010), extends the analysis to children of lower secondary school age. Any child enrolled in primary, secondary or tertiary education is considered in school, regardless of the child's age. Only children that are truly excluded from education are counted as out of school.

The paper's regional and global estimates of the number and percent of children out of school are reproduced in this article. Table 1 lists the population of primary and lower secondary school age in 2007. Worldwide there were about 653 million children of primary school age and 388 million children of lower secondary school age. More than half of these children lived in South and West Asia and East Asia and the Pacific.

Table 1: Population of primary and lower secondary school age by region (million), 2007
Region Primary Lower secondary Total
Sub-Saharan Africa 124.9 57.9 182.7
Arab States 41.4 21.9 63.5
South and West Asia 176.8 106.8 284.2
Central Asia 5.6 8.0 13.8
East Asia and the Pacific 173.8 106.5 281.2
Central and Eastern Europe 22.2 20.3 42.1
North America and Western Europe 50.8 31.0 81.6
Latin America and the Caribbean 58.6 35.9 93.7
World 652.6 388.2 1042.5
Source: UIS 2010, page 10, Table 1; author's calculations. - Note: Figures may not sum due to rounding.

Figure 1 illustrates the regional distribution of the population of primary and lower secondary school age. The number of children in these age groups is plotted along the horizontal axis. The vertical axis indicates the share of children of primary and lower secondary school age in each region. The regions with the largest number of school-age children in 2007 were South and West Asia (284 million), East Asia and the Pacific (281 million), and Sub-Saharan Africa (183 million). More than 60 percent of the combined population of primary and lower secondary school age were of primary school age. Central Asia and Central and Eastern Europe were exceptions, with a greater share of children of lower secondary school age than in other regions. The large share of primary-age children in Sub-Saharan Africa is a symptom of its high population growth rate.

Figure 1: Population of primary and lower secondary school age by region, 2007
Spine plot showing the distribution of the population of primary and lower secondary school age by region in 2007
Source: UIS 2010, page 10, Table 1; author's calculations. - CEE: Central and Eastern Europe, NAWE: North America and Western Europe, LAC: Latin America and the Caribbean.

The share and number of children out of school are listed in Table 2. At the global level, 11 percent or 72 million of all children of primary school age and 18 percent or 71 million of all children of lower secondary school age were out of school. The combined global share of children out of school was 14 percent. Out-of-school rates were highest in Sub-Saharan Africa, where 26 percent of all primary school-age children and 37 percent of all secondary school-age children were excluded from education.

Table 2: Children of primary and lower secondary school age out of school by region, 2007
Region Primary Lower secondary Total
Percent Million Percent Million Percent Million
Sub-Saharan Africa 25.8 32.2 36.8 21.3 29.3 53.5
Arab States 13.9 5.8 19.5 4.3 15.8 10.0
South and West Asia 10.2 18.0 27.3 29.1 16.6 47.2
Central Asia 4.8 0.3 4.9 0.4 4.8 0.7
East Asia and the Pacific 5.2 9.0 10.0 10.6 7.0 19.7
Central and Eastern Europe 7.0 1.6 9.6 1.9 8.3 3.5
North America and Western Europe 3.8 1.9 4.3 1.3 4.0 3.3
Latin America and the Caribbean 5.1 3.0 5.5 2.0 5.3 5.0
World 11.0 71.8 18.3 71.0 13.7 142.8
Source: UIS 2010, page 10, Table 1.

As illustrated in Figure 2, out-of-school rates are always higher at the secondary level of education than at the primary level. This is not surprising because not all students complete primary education and not all of those who graduate from primary school transfer to secondary school to continue their education. In addition to Sub-Saharan Africa, South and West Asia (27 percent) and the Arab States (20 percent) also had a high share of children of secondary school age out of school.

Figure 2: Children of primary and lower secondary school age out of school by region, 2007
Bar chart showing the share of children of primary and lower secondary school age out of school by region in 2007
Source: UIS 2010, page 10, Table 1.

The distribution of children out of school by region in 2007 is shown in Figure 3. A comparison with the population distribution in Figure 1 makes clear that children from Sub-Saharan Africa and South and West Asia were disproportionately more likely to be out of school than children from other regions. More than two thirds of the 143 million out-of-school children of primary and lower secondary age were from Sub-Saharan Africa (54 million) and South and West Asia (47 million). 20 million children out of school lived in East Asia and 10 million in the Arab States. The remaining 13 million children out of school were from Latin America and the Caribbean (5 million), Central and Eastern Europe (3.5 million), North America and Western Europe (3.3 million), and Central Asia (0.7 million).

Figure 3: Children of primary and lower secondary school age out of school by region, 2007
Spine plot showing the distribution of children of primary and lower secondary school age out of school by region in 2007
Source: UIS 2010, page 10, Table 1. - CEE: Central and Eastern Europe, NAWE: North America and Western Europe, LAC: Latin America and the Caribbean.

In Sub-Saharan Africa, the Arab States, North America and Western Europe, and Latin America and the Caribbean most children out of school were of primary age. In South and West Asia, East Asia, and Central and Eastern Europe most children out of school were of lower secondary age. At the global level, the number of out-of-school children of primary school age and lower secondary school age was roughly equal (see Table 2).

References
Related articles
External links
Friedrich Huebler, 28 March 2010 (edited 17 August 2011), Creative Commons License
Permanent URL: http://huebler.blogspot.com/2010/03/coos.html

Sunday, February 8, 2009

Population structure and children out of school

Sub-Saharan Africa is the region with the highest percentage of children out of school. At the same time, the population of most countries in Sub-Saharan Africa is increasing and children of primary school age constitute a large and growing share of the population.

The link between the population structure and the number of children out of school is shown in the figures and table below. Data on the share of children of primary school age out of school were obtained from the Childinfo website of UNICEF. The official primary school ages in individual countries from the Data Centre of the UNESCO Institute for Statistics were combined with demographic data from the UN Population Division to calculate the share of children of primary school age in each country's population. In total, data for 177 countries were available. All values are for the year 2007.

In Figure 1, the population of primary school age as a percentage of the total population is plotted along the horizontal axis. At the lower end of the scale are Belarus, Bulgaria, Germany, Latvia, Russia, and Ukraine. In these countries, children of primary school age account for less than 4 percent of the total population. The countries with the highest share of children of primary school age are located in Sub-Saharan Africa: Uganda (21 percent), Zambia (20 percent), Lesotho, Mozambique, Somalia (19 percent), Malawi, Swaziland, and Tanzania (18 percent).

The share of children out of school is plotted along the vertical axis. For five countries, the available statistics indicate that less than 0.5 percent of children are out of school: Japan, Malaysia, Spain, Uruguay, and Uzbekistan. In eight countries, half or more of all children are not in school: Somalia (77 percent), Chad (64 percent), Niger (62 percent), Liberia (61 percent), Ethiopia (55 percent), Eritrea (54 percent), Burkina Faso (53 percent), and Haiti (50 percent). Except for Haiti and Pakistan, the 20 countries with the highest share of children out of school are located in Sub-Saharan Africa.

The color of the marker for each country in Figure 1 indicates the geographic region according to the grouping used for the UN Millennium Development Goals (MDG). The size of each marker indicates the absolute size of the population of primary school age. The big red circle is the marker for India and the big green circle is the marker for China. Other countries with a large number of children of primary school age are Indonesia in South-Eastern Asia, USA in the developed countries, and Nigeria in Sub-Saharan Africa.

The distribution of the points in Figure 1 shows that countries with a small share of children of primary school age in the total population also tend to have a small percentage of children out of school. By contrast, countries with a relatively large population of primary school age also have a higher percentage of children out of school. This positive correlation between the two variables is confirmed by a linear regression of the percent of children out of school on the percent of children of primary school age and the squared percent of children of primary school age. The predicted share of children out of school is indicated by the dark gray line. The light gray band around the prediction line indicates the 95 percent confidence interval.

Figure 1: Population of primary school age and children out of school by country, 2007
Scatter plot with country data on the share of children of primary school age and the share of children out of school in 2007
Note: Marker size indicates the number of children of primary school age in a country.
Data source: UNESCO Institute for Statistics, UNICEF, UN Population Division.

For Figure 2, the data from the 177 countries in Figure 1 were combined by MDG region. The share of children of primary school age in a region's population is plotted along the horizontal axis and the share of children out of school along the vertical axis. The colors of the markers are the same as in Figure 1. The regional values, summarized in Table 1, reflect the 177 countries for which data were available.

Figure 2: Population of primary school age and children out of school by MDG region, 2007
Scatter plot with regional data on the share of children of primary school age and the share of children out of school in 2007
Note: Marker size indicates the number of children of primary school age in a region.
Data source: UNESCO Institute for Statistics, UNICEF, UN Population Division.

At the global level, about 10 percent of the population are of primary school age. The regional values range from 4.6 percent in the Commonwealth of Independent States to 16.5 percent in Sub-Saharan Africa. The average share of children out of school across the 177 countries with data is 15.5 percent. In six regions, fewer than 10 percent of all children are out of school: Commonwealth of Independent States, developed countries, Eastern Asia, Latin America and the Caribbean, Northern Africa, and South-Eastern Asia. Sub-Saharan Africa has by far the highest share of children out of school, with 36.2 percent, followed by Southern Asia with 20 percent and Oceania with 17.1 percent.

Table 1: Population of primary school age and children out of school by MDG region, 2007
MDG region
Population of primary school age as share of total population (%) Children of primary school age out of school (%)
Developed countries 6.4 4.6
Commonwealth of Independent States 4.6
6.8
Eastern Asia 7.1
0.8
South-Eastern Asia 10.8
6.5
Oceania 14.5
17.1
Southern Asia 10.8
20.0
Western Asia 12.5 12.5
Northern Africa 11.9
5.9
Sub-Saharan Africa 16.5
36.2
Latin America and the Caribbean 10.3 7.2
World 9.8 15.5
Data source: UNESCO Institute for Statistics, UNICEF, UN Population Division.

Due to their current population structure and demographic trends, countries in Sub-Saharan Africa have to provide schools and teachers for a relatively larger number of children than countries in other regions. The Millennium Development Goal of universal primary education by 2015 is therefore more difficult to meet for countries in Sub-Saharan Africa than for countries with a relatively small and constant or shrinking population of primary school age.

Data sources
Related articles
External links
Friedrich Huebler, 8 February 2009 (edited 9 February 2009), Creative Commons License
Permanent URL: http://huebler.blogspot.com/2009/02/coos.html

Sunday, November 16, 2008

Pupil/teacher ratio in secondary school

The pupil/teacher ratio is an indicator of education quality. In crowded classrooms with a high number of pupils per teacher the quality of education suffers. For pupils it is difficult to follow the course and teachers can dedicate less time to the needs of each individual student. Data from UNESCO on the pupil/teacher ratio in primary school show that crowded classrooms are more common in Sub-Saharan Africa and Southern Asia than in other parts of the world. 22 of the 27 countries with 40 or more pupils per primary school teacher are located in Sub-Saharan Africa.

In secondary school, pupil/teacher ratios are lower than in primary school. The Data Centre of the UNESCO Institute for Statistics provides the pupil/teacher ratio in secondary school for 189 countries and territories. For 100 countries, the pupil/teacher ratios are from 2006, 9 countries have data from 2007, 51 countries have data from 2004 or 2005, and the remaining 29 countries have data from 1999 to 2003. For the map below, all countries with data were divided into five groups:
  • Fewer than 10 pupils per teacher: 24 countries
  • 10 to 19 pupils per teacher: 107 countries
  • 20 to 29 pupils per teacher: 41 countries
  • 30 to 39 pupils per teacher: 13 countries
  • 40 or more pupils per teacher: 4 countries
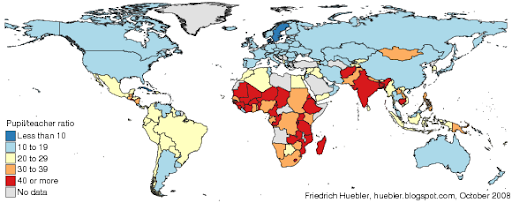
Pupil/teacher ratio in secondary school, circa 2006
Map of the world showing national pupil/teacher ratios in secondary school
Data source: UNESCO Institute for Statistics, Data Centre, May 2008.

The lowest pupil/teacher ratios in secondary school were reported for Bermuda (6.0), Tokelau (7.0), Portugal (7.1), and Andorra (7.8). 20 additional countries have pupil/teacher ratios above 8 and below 10: Armenia, Azerbaijan, Belarus, British Virgin Islands, Cayman Islands, Croatia, Georgia, Greece, Kuwait, Lebanon, Liechtenstein, Lithuania, Malta, Monaco, Niue, Norway, Qatar, Russia, Sweden, and Turks and Caicos Islands.

More than half of all countries - including most countries in North and South America, Europe, the Middle East, and East Asia - have pupil/teacher ratios between 10 and 19. The group also includes some countries in other regions. Although pupil/teacher ratios in Sub-Saharan Africa are generally higher than in other parts of the world, the following countries from the region have only 10 to 19 pupils per secondary school teacher: Angola, Botswana, Burundi, Cameroon, Cape Verde, Comoros, Democratic Republic of Congo, Ghana, Guinea-Bissau, Mauritius, Seychelles, and Swaziland. 22 of the 41 countries with pupil/teacher ratios between 20 and 29 are also located in Sub-Saharan Africa.

17 countries have 30 or more pupils per teacher in secondary school and 10 of these countries are in Sub-Saharan Africa. The countries with 30 to 39 pupils per teacher are Chad, Congo, Djibouti, Honduras, India, Kenya, Mozambique, Myanmar, Nepal, Nicaragua, Philippines, South Africa, and Zambia. Classes at the secondary level of education are most crowded in Nigeria (pupil/teacher ratio 40.2), Pakistan (41.9), Malawi (45.6), and Eritrea (54.4).

The following table lists the average pupil/teacher ratio in secondary school by Millennium Development Goal region. The Commonwealth of Independent States (10.9), the developed countries (11.4), Oceania (14.8), Western Asia (15.3), Latin America and the Caribbean (16.6), Eastern Asia (19.0), and Northern Africa (19.0) have average pupil/teacher ratios below 20. Pupil/teacher ratios are highest in South-Eastern Asia (22.8), Sub-Saharan Africa (25.8), and Southern Asia (26.4). The global average is 18.0 pupils per teacher in secondary school. These average values are unweighted, which means that each country is given the same weight within its region, regardless of the size of its population.

Average pupil/teacher ratio in secondary school by MDG region, circa 2006
MDG region
Pupil/teacher ratio
Developed countries 11.4
Commonwealth of Independent States 10.9
Eastern Asia 19.0
South-Eastern Asia 22.8
Oceania 14.8
Southern Asia 26.4
Western Asia 15.3
Northern Africa 19.0
Sub-Saharan Africa 25.8
Latin America and the Caribbean 16.6
World 18.0
Data source: UNESCO Institute for Statistics, Data Centre, May 2008. Regional and global averages are unweighted.

The data analyzed in this article can be downloaded from the UNESCO Institute for Statistics Data Centre, under Predefined Tables - Education - Table 11: Indicators on teaching staff at ISCED levels 0 to 3.

Related articles
External links
Friedrich Huebler, 16 November 2008, Creative Commons License
Permanent URL: http://huebler.blogspot.com/2008/11/ptr.html

Saturday, November 1, 2008

Education disparity trends in South Asia

An article on education disparity in South Asia described a newly developed Education Parity Index (EPI). This index combines data on primary school attendance, secondary school attendance and the survival rate to the last grade of primary school, disaggregated by gender, area of residence and household wealth. The value of the EPI has a theoretical range of 0 to 1, where 1 indicates absolute parity.

Through a combination of survey data from several years it is possible to analyze trends in disparity as measured by the EPI. For the trend analysis, data from the following South Asian household surveys - mainly Demographic and Health Surveys (DHS) and Multiple Indicator Cluster Surveys (MICS) - were available.
  • Afghanistan: 2003 MICS
  • Bangladesh: 1999-2000 DHS, 2004 DHS, 2006 DHS
  • India: 1998-99 DHS, 2000 MICS, 2005-06 DHS
  • Nepal: 1996 DHS, 2000 MICS, 2001 DHS, 2006 DHS
  • Pakistan: 2000-01 survey, 2006-07 DHS
The graph below plots the EPI values calculated from each survey. Due to a lack of data, no trends can be shown for Afghanistan.

Education disparity trends in South Asia, 1996-2007
Trend lines with Education Parity Index values between 1996 and 2007
Data source: Demographic and Health Surveys (DHS), Multiple Indicator Cluster Surveys (MICS), 1996-2007.

In Bangladesh, India and Nepal, the EPI has increased from the earliest to the latest year with data, indicating a decrease in disparity over the period of observation. In Bangladesh, the EPI grew from 0.79 in 2000 to 0.84 in 2006. In India, the EPI was at 0.77 in 1999 and 0.82 in 2006. In Nepal, the EPI shows the biggest increase, from 0.67 in 1996 to 0.83 in 2006, interrupted by a decrease from 2000 to 2001. Compared to the other countries, Nepal has thus made the most progress toward parity in the education system.

For Pakistan, the EPI has decreased from 2000 to 2007, indicating an increase in disparity. However, an inspection of the underlying data reveals that the earlier survey did not provide data on household wealth. Disparities related to wealth are usually greater than disparities related to gender or area of residence. If data on wealth had been available, the EPI for 2000 would most likely have been lower. The data from the 2006-07 DHS confirm this assumption. Children from the poorest quintile have much lower attendance and survival rates than children from the richest quintile, and the disparity between these two groups of children is much greater than the disparity between boys and girls and between children from urban and rural households. For example, the primary school net attendance rate (NAR) in Pakistan is 46 percent among children from the poorest household quintile but twice as high, 93 percent, among children from the richest quintile. In comparison, the primary NAR is 76 percent for boys, 67 percent for girls, 82 percent for urban children, and 67 percent for rural children according to the 2006-07 DHS.

The data gaps in the graph bring to attention one limitation of the EPI. The net enrollment rate and other data published annually by UNESCO in the Global Education Digest or the Education For All Global Monitoring Report are not disaggregated beyond gender and can therefore not be used to calculate the EPI. On the other hand, national household survey data, which permit the required level of disaggregation, are not collected every year but only every four or five years, on average.

Related articles
External links
Friedrich Huebler, 1 November 2008 (edited 22 November 2008), Creative Commons License
Permanent URL: http://huebler.blogspot.com/2008/11/south-asia.html

Sunday, October 26, 2008

Pupil/teacher ratio in primary school

Global primary school attendance rates have been on a steady upward trend over the past years. As the world moves closer to the goal of universal primary education, the issue of education quality attracts increasing attention. One measure of education quality is the pupil/teacher ratio, the number of pupils per teacher in a school. Teachers of a large class can dedicate less time to each pupil than in a small class. For the pupils, crowded classrooms make it difficult to concentrate on the material and to learn. The results of overcrowding are lower academic achievement and increased dropout rates.

The map below displays the pupil/teacher ratio in primary school in 194 countries and territories for which data were available. The data were obtained from the UNESCO Institute for Statistics. For 124 countries, the pupil/teacher ratios are from 2006, 12 countries have data from 2007, 42 countries have data from 2004 or 2005, and the remaining 16 countries have data from 1999 to 2003. For the map, all countries were divided into five groups:
  • Fewer than 10 pupils per teacher: 7 countries
  • 10 to 19 pupils per teacher: 90 countries
  • 20 to 29 pupils per teacher: 43 countries
  • 30 to 39 pupils per teacher: 27 countries
  • 40 or more pupils per teacher: 27 countries
Pupil/teacher ratio in primary school, circa 2006
Map of the world showing national pupil/teacher ratios in primary school
Data source: UNESCO Institute for Statistics, Data Centre, May 2008.

The lowest pupil/teacher ratios in primary school were observed in Tokelau (5.8), San Marino (6.3), Bermuda (8.3), Liechtenstein (8.4), Denmark (9.9), and Sweden and Cuba (10.0). Most developed countries, countries in Eastern Europe and former members states of the Soviet Union have pupil/teacher ratios between 10 and 19. Some countries in East and South-East Asia, the Middle East, Africa, and Latin America also belong to this group, among them China, the world's most populous country, with a pupil/teacher ratio of 18.3. The majority of countries in Latin America, as well as some countries in Africa and Asia, have pupil/teacher ratios between 20 and 29.

Pupil/teacher ratios above 30 are common in Sub-Saharan Africa and South Asia. In 11 countries, primary school teachers have more than 50 pupils on average: Afghanistan (83.4), Mozambique (67.4), Rwanda (65.9), Chad (63.2), Mali (55.6), Congo (54.8), Burundi (54.2), Tanzania (53.1), Zambia (51.2), Bangladesh (50.9), and Cambodia (50.4). 22 of the 27 countries with 40 or more pupils per teacher are located in Sub-Saharan Africa.

The following table lists the average pupil/teacher ratio in primary school by Millennium Development Goal region. The highest pupil/teacher ratios exist in Sub-Saharan Africa (40.7) and Southern Asia (37.8). In contrast, the average pupil/teacher ratio in the developed countries is 13.7. In Western Asia (17.8), the Commonwealth of Independent States (17.9), and Oceania (19.8), the average pupil/teacher ratio is also below 20. The global average is 24.6 pupils per teacher in primary school. All regional and global averages are not weighted the population of each country; instead, each country is given the same weight within its region, regardless of the size of its population.

Pupil/teacher ratio in primary school by MDG region, circa 2006
MDG region
Pupil/teacher ratio
Developed countries 13.7
Commonwealth of Independent States 17.9
Eastern Asia 23.4
South-Eastern Asia 26.5
Oceania 19.8
Southern Asia 37.8
Western Asia 17.8
Northern Africa 24.4
Sub-Saharan Africa 40.7
Latin America and the Caribbean 21.3
World 24.6
Data source: UNESCO Institute for Statistics, Data Centre, May 2008. Regional and global averages are unweighted.

The data analyzed in this article can be downloaded from the UNESCO Institute for Statistics Data Centre, under Predefined Tables - Education - Table 11: Indicators on teaching staff at ISCED levels 0 to 3.

Related articles
External links
Friedrich Huebler, 26 October 2008 (edited 16 November 2006), Creative Commons License
Permanent URL: http://huebler.blogspot.com/2008/10/ptr.html

Friday, October 17, 2008

UN Millennium Development Goals Report 2008

Cover of UN MDG Report 2008In August 2008, the United Nations published the latest edition of its annual report on progress toward the Millennium Development Goals (MDG). The Millennium Development Goals Report 2008 presents data for each of the eight MDGs.
  1. Eradicate extreme poverty and hunger
  2. Achieve universal primary education
  3. Promote gender equality and empower women
  4. Reduce child mortality
  5. Improve maternal health
  6. Combat HIV/AIDS, malaria and other diseases
  7. Ensure environmental sustainability
  8. Develop a global partnership for development
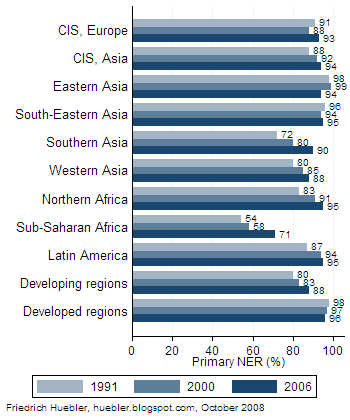
In the section on MDG 2, universal primary education, trends in primary school enrollment from 1991 to 2006 are shown for each MDG region. One region, the Commonwealth of Independent States, is further divided into countries in Europe and Asia. No data are provided for the Oceania region.

Primary school net enrollment rate, 1991-2006
Bar graph with regional primary school net enrollment rates from 1991 to 2006
Source: United Nations, The Millennium Development Goals Report 2008, page 12.

Six MDG regions have reached primary school net enrollment rates at or above 90 percent: Commonwealth of Independent States (Europe and Asia), Eastern Asia, South-Eastern Asia, Southern Asia, Northern Africa, and Latin America. Western Asia is slightly behind with a primary NER of 88 percent. In absolute terms, Sub-Saharan Africa has made the most progress since the turn of the millennium, with a 13 percent increase in the primary NER from 58 percent in 2000 to 71 percent in 2006. This increase was achieved in spite of strong growth in the population of primary school age. Still, three out of ten children of primary school age in Sub-Saharan Africa are not enrolled in primary school. In all developing regions combined, the primary NER rose from 80 percent in 1991 to 88 percent in 2006. In contrast, the primary NER in the developed regions declined from 98 percent in 1991 to 96 percent in 2006.

References
  • United Nations. 2008. The millennium development goals report 2008. New York: United Nations. (Download PDF document, 3.3 MB)
Related articles
External links
Friedrich Huebler, 17 October 2008, Creative Commons License
Permanent URL: http://huebler.blogspot.com/2008/10/mdg-report.html

Sunday, October 12, 2008

Education disparity in South Asia

Cover of "Beyond gender: Measuring disparity in South Asia using an education parity index" by Friedrich HueblerA new publication by Friedrich Huebler describes education disparity in the countries of South Asia. The report Beyond gender: Measuring disparity in South Asia using an education parity index was published by the UNICEF regional office for South Asia in its series of papers on girls' education.

Analysis of disparities in national education systems is often limited to gender although other dimensions of disparity are also important. The publication presents data on disparity in primary and secondary education by gender, area of residence and household wealth for countries in South Asia.

To facilitate the interpretation of complex data a newly developed Education Parity Index is introduced. The EPI combines information on disparities across different education indicators and across different groups of disaggregation. This distinguishes the EPI from existing indicators of disparity in education, including the gender parity index and the EFA development index. The EPI is flexible and can be modified according to national priorities, for example by including information on disparities between different ethnic groups.

The use of the EPI as a tool to assess education disparities is illustrated with household survey data from Afghanistan, Bangladesh, India, Nepal and Pakistan. For each country, the report describes how the EPI is calculated. In addition, national trends in education disparity from 1996 to 2006 are presented.

References
  • Huebler, Friedrich. 2008. Beyond gender: Measuring disparity in South Asia using an education parity index. Kathmandu: UNICEF. (Download PDF document, 194 KB)
External links
Related articles
Friedrich Huebler, 12 October 2008 (edited 30 January 2009), Creative Commons License
Permanent URL: http://huebler.blogspot.com/2008/10/epi.html

Sunday, June 15, 2008

Adult literacy in 2007

The release of new literacy data by the UNESCO Institute for Statistics (UIS) in May 2008 provides an opportunity to update an article on adult literacy rates that was published on this site in July 2007. The adult literacy rate is the share of literate persons in the population aged 15 years and older. Compared to the previous analysis, literacy data for more countries and for more recent years is available. An article on literacy data from the UIS provides additional information on the latest UIS database.

Before the update of May, the UIS database contained adult literacy rates for 136 countries and territories. For 10 countries, the most recent data was from 2005, for 30 countries from 2004, and for 5 countries from 2003. The remaining countries had data from 2002 or earlier years.

The UIS Data Centre now offers the adult literacy rate for 145 countries and territories. For 115 countries, data from 2007 is available. The map below displays the adult literacy rate for all countries with data.

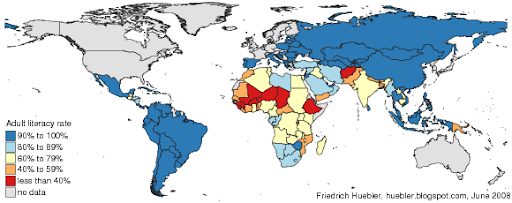
Adult literacy rates by country, 2007
World map with adult literacy rates by country in 2007
Source: UNESCO Institute for Statistics, Data Centre, May 2008

The unweighted mean of the adult literacy rate is 81.2 percent. In 71 countries - including most of Eastern Europe, East and Southeast Asia, and Latin America - 90 percent or more of the adult population can read and write. The highest adult literacy rate, 99.8 percent, is reported for Cuba, Estonia and Latvia. Most countries without data are in the group of industrialized countries, where literacy rates are also likely to be above 90 percent. In 23 countries, the adult literacy rate is between 80 and 90 percent.

At the other extreme are eight countries with literacy rates below 40 percent: Mali (23.3), Chad (25.7), Afghanistan (28.0), Burkina Faso (28.7), Guinea (29.5), Niger (30.4), Ethiopia (35.9), and Sierra Leone (38.1). Another 16 countries have literacy rates between 40 and 60 percent: Benin (40.5), Senegal (42.6), Mozambique (44.4), Central African Republic (48.6), Cote d'Ivoire (48.7), Togo (53.2), Bangladesh (53.5), Pakistan (54.9), Liberia (55.5), Morocco (55.6), Bhutan (55.6), Mauritania (55.8), Nepal (56.5), Papua New Guinea (57.8), Yemen (58.9), and Burundi (59.3). Almost all of these countries are in Sub-Saharan Africa and South Asia.

Finally, the world's two largest countries in terms of population have very different literacy rates. In China, the adult literacy rate is 93.3 percent. In India, only 66 percent of the adult population can read and write.

The complete dataset with adult and youth literacy rates is available at the UIS Data Centre.

Related articles
External links
Friedrich Huebler, 15 June 2008, Creative Commons License
Permanent URL: http://huebler.blogspot.com/2008/06/adult-literacy.html

Wednesday, March 12, 2008

Regional distribution of children out of school

UNICEF estimates that 93 million children of primary school age were out of school in 2006. The graph below presents the regional distribution of these children according to the country classification used by UNICEF. The majority of children out of school, 41 million, lived in Sub-Saharan Africa, the region with the world's lowest primary school enrollment rates. In South Asia, 32 million children were out of school, most of them in India, the country with the world's largest population of children not in school.

In other regions, fewer children of primary school age were not in school. The Middle East and North Africa, East Asia and the Pacific, Latin America and the Caribbean, the industrialized countries, and the countries of Central and Eastern Europe and the Commonwealth of Independent States (CIS) combined account for 20 million children out of school, only one fifth of the global number.

Estimates for individual countries are available on the Childinfo website of UNICEF. The site also describes the data sources and methodology for UNICEF's calculation of the number of children out of school.

Regional distribution of children of primary school age out of school (in millions), 2006
Pie chart with the regional distribution of children out of primary school in 2006
Source: UNICEF, 2007, Progress for Children.

References
  • United Nations Children's Fund (UNICEF). 2007. Progress for children: A World Fit for Children statistical review. New York: UNICEF. (Download PDF, 3.6 MB)
Related articles

External links

Friedrich Huebler, 12 March 2008 (edited 8 February 2009), Creative Commons License
Permanent URL: http://huebler.blogspot.com/2008/03/regional-distribution-of-children-out.html

Monday, March 3, 2008

Global population of primary school age, 2000-2015

The second UN Millennium Development Goal (MDG) is the achievement of universal primary education by the year 2015. Since 2000, many countries have come closer to this goal, but at the current rate of progress it is likely that the goal will be missed when the year 2015 arrives.

To ensure that all children attend and complete primary school, countries have to provide enough schools, teachers, and training materials. Future demographic trends are one factor that has to be taken into consideration to plan for the education system. The UN Population Division provides population projections that can be combined with data on national primary school ages from the UNESCO Institute for Statistics to calculate national and regional trends in the population of primary school age.

The graph and table below depict the population trends by MDG region. At the global level, the number of children of primary school age is projected to increase from 655 million in 2000 to 668 million in 2015. In some regions, the population of primary school age is expected to shrink, while other regions experience a population increase.

Population of primary school age, 2000-2015
Graph with population of primary school age from 2000 to 2015
Data sources: (1) Population: UN Population Division, World Population Prospects 2006. (2) Primary school ages: UNESCO Institute for Statistics, Data Centre.

Two regions with very different trends stand out. In Sub-Saharan Africa, the number of children of primary school age is estimated to grow by 37 percent or 41 million children over the period 2000 to 2015. Countries in this region not only have to provide schools and teachers for all children that have been born so far, they have to increase the capacity of the education system further to accommodate the rapidly growing population. Even wealthy countries with a well-developed education infrastructure would struggle if they had to expand the capacity of their education system by more than one third over a period of 15 years.

In contrast, the population of primary school age in Eastern Asia is expected to drop by 25 percent or 29 million between 2000 and 2015, easing the pressure on the education system. Other regions with a projected decrease in the population of primary school age are the Commonwealth of Independent States and the developed countries. In Latin America and the Caribbean and in South-Eastern Asia, the population is expected to be virtually unchanged.

In Western Asia, Southern Asia, Oceania, and Northern Africa, the projections also show an increase in the population of primary school age, but at a lower relative and absolute level than Sub-Saharan Africa. Countries in the former regions therefore face fewer demographic obstacles on the path to universal primary education than countries in Sub-Saharan Africa.

Population of primary school age, 2000-2015
Region Population of primary school age (million) Change 2000-2015
2000 2015 Million Percent
Oceania 1.1 1.3 0.2 22.8
Commonwealth of Independent States 15.1 12.3 -2.9 -19.0
Northern Africa 19.7 20.0 0.3 1.8
Western Asia 23.9 27.2 3.2 13.5
Latin America and the Caribbean 58.1 57.7 -0.4 -0.7
South-Eastern Asia 63.4 62.9 -0.5 -0.8
Developed countries 67.8 65.0 -2.8 -4.2
Sub-Saharan Africa 111.4 152.5 41.1 36.9
Eastern Asia 117.3 88.2 -29.1 -24.8
Southern Asia 177.0 181.2 4.2 2.4
World 654.9 668.3 13.4 2.0
Data sources: (1) Population: UN Population Division, World Population Prospects 2006. (2) Primary school ages: UNESCO Institute for Statistics, Data Centre.

References
External links
Related articles
Friedrich Huebler, 3 March 2008 (edited 8 February 2009), Creative Commons License
Permanent URL: http://huebler.blogspot.com/2008/03/global-population-of-primary-school-age.html

Sunday, February 24, 2008

UNICEF releases new MICS survey data

UNICEF has released the first datasets from the third round of Multiple Indicator Cluster Surveys (MICS), conducted in 2005 and 2006. The first round of MICS surveys was carried out around 1995, followed by a second round of surveys around 2000.

MICS surveys are nationally representative household surveys that were developed by UNICEF in collaboration with other organizations to collect data on the situation of children and women. The most recent round of surveys collected data on household characteristics, education, child labor, water and sanitation, child mortality, maternal and newborn health, knowledge of HIV and AIDS, contraceptive use, birth registration, and other areas. The data can be used to track progress toward the UN Millennium Development Goals and other goals. The MICS program is described in detail on the Childinfo website of UNICEF.

In the area of education, the latest MICS surveys provide data for the following household member characteristics:
  • highest level of education
  • current school attendance
  • school attendance in the previous year
  • literacy
With the data it is possible to calculate primary and secondary school enrollment rates, repetition and dropout rates, survival rates, and other education statistics. The MICS surveys also allow detailed disaggregation of the data, for example by gender, area of residence, or household wealth. Examples for the kind of analysis that is possible with MICS data can be seen in previous articles on this site, for example on child labor and school attendance in Bolivia, educational attainment in India, or years of schooling and literacy.

The MICS datasets are available for download in SPSS format from the Childinfo website. The datasets are provided free of charge but interested researchers have to apply for a MICS username and password. At the time of writing, datasets from the following countries were available: Bangladesh, Belarus, Côte d'Ivoire, Cuba, Jamaica, Mongolia, Montenegro, Serbia, Sierra Leone, and Uzbekistan. In addition, survey questionnaires, survey reports, and a set of standard tabulations are provided. The questionnaires, tables, and reports can be downloaded without access restrictions.

External links
Related articles
Friedrich Huebler, 24 February 2008, Creative Commons License
Permanent URL: http://huebler.blogspot.com/2008/02/unicef-releases-new-mics-survey-data.html

Monday, February 11, 2008

Survival rate to the last grade of primary school

Since January 2008, the survival rate to the last grade of primary school is an official indicator to track progress toward the second UN Millennium Development Goal (MDG), which calls for universal primary education by the year 2015. The survival rate to the last grade is the percentage of a cohort of students who enter the first grade of primary education and who are expected to reach the last grade, regardless of repetition.

As an example, assume that primary school has four grades. Assume further that 100 children enter grade one and that 5 of these children drop out from school before they reach the last grade. The remaining 95 children reach grade four, with or without repeating one or more grades. In this case, the survival rate to the last grade is 95 / 100 = 95%.

As a previous article on this site explains, the survival rate to grade five was used an official indicator for MDG 2 until 2007. The survival rate to the last grade is a better indicator because it can be calculated for countries with fewer than five grades of primary school and because it is more in line with the goal of universal primary education.

The map below shows the most recent statistics on the survival rate to the last grade from the UNESCO Institute for Statistics (UIS). In most cases, the statistics are from the year 2005. The next revision of the UIS database, expected in mid-2008, will contain survival rates for 2006.

Survival rate to the last grade of primary school, 2005
Map of the world showing national survival rates to the last grade of primary school, 2005
Data source: UNESCO Institute for Statistics, Data Centre, January 2008.

The current UIS database lists the survival rate to the last grade for 154 countries. The values range from 25% in Nauru and Uganda to 100% in Croatia, Cyprus, Iceland, Israel, Italy, Norway, Spain, and Tajikistan. In addition to Nauru and Uganda, nine other countries have survival rates below 50%: Chad (26%), Rwanda (31%), Equatorial Guinea (33%), Malawi (34%), Mauritania (39%), Madagascar (43%), Turks and Caicos Islands (45%), and Benin and Mozambique (46%). In these eleven countries, more than half of all children who start attending primary school drop out before they reach the last grade.

Ten countries have survival rates in the range 50-60%, 20 each are in the range 60-70% and 70-80%, 26 countries have survival rates from 80% to 90%, and in 67 countries 90% or more of all primary school entrants reach the last grade. As the map shows, almost all countries with survival rates below 60% are located in Sub-Saharan Africa.

The following table compares average survival rates in the different MDG regions. In the group of developed countries, in the countries from the Commonwealth of Independent States (former Soviet Republics), and in Eastern Asia, almost all children reach the last grade of primary school. In contrast, fewer than two thirds of all first grade students in Sub-Saharan Africa reach the last grade. Survival rates are also relatively low in Northern Africa and Oceania (78%), and in Southern and South-Eastern Asia (84%). In Western Asia and Latin America, around 90% of all first grade students reach the last grade.

Survival rate to the last grade of primary school, 2005
MDG region Survival rate to last grade (%)
Male FemaleTotal
Developed countries 99.199.299.2
Commonwealth of Independent States99.699.099.4
Eastern Asia98.998.898.8
South-Eastern Asia84.584.384.4
Oceania78.478.278.3
Southern Asia84.583.083.8
Western Asia88.786.988.0
Northern Africa75.381.878.3
Sub-Saharan Africa64.363.163.9
Latin America and the Caribbean90.590.190.4
World85.184.584.9
Data source: UNESCO Institute for Statistics, Data Centre, January 2008.

The average survival rate to the last grade at the global level is 85%, with virtually no difference between boys and girls. However, gender disparities exist in some regions, in particular in Northern Africa, were girls, with an average survival rate of 82%, are more likely to continue their education to the last grade of primary school than boys, whose survival rate is 75%.

Related articles
External links
Friedrich Huebler, 11 February 2008, Creative Commons License
Permanent URL: http://huebler.blogspot.com/2008/02/survival-rate-to-last-grade-of-primary.html

Sunday, January 20, 2008

Secondary school attendance in India in 2006

In India, 83 percent of all children of primary school age (6-10 years) attend primary school, as described in a previous article on this site. Primary school net attendance rates (NAR) are highest in urban areas and among children from the richest households.

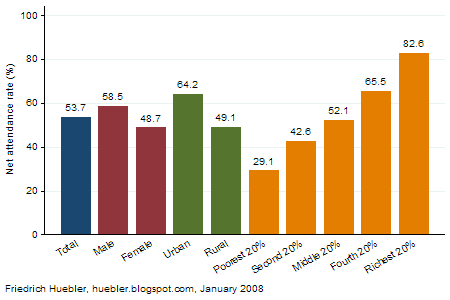
Fewer children continue their education at the secondary level. Data from a nationally representative Demographic and Health Survey (called National Family Health Survey in India) conducted in 2005 and 2006 shows that only 54 percent of all children of secondary school age (11-17 years) attend secondary school. In addition, there are large disparities between different groups of children, as the graph below demonstrates. Boys and children from urban areas are more likely to be in secondary school than girls and children from rural areas.

Secondary school net attendance rate (NAR), India 2006
Bar graph showing secondary school net attendance rate in India in 2006
Data source: India Demographic and Health Survey 2005-06.

The biggest disparities exist between children from different wealth quintiles. Among children from the richest 20 percent of all households, the secondary NAR is 83 percent, compared to a secondary NAR of only 29 percent among children from the poorest households. The respective primary NAR values are 96 percent for children from the richest quintile and 69 percent for children from the poorest quintile. Children from poor households are not only less likely to enter school than children from wealthier households, they are also far less likely to continue their education after four years of primary school.

References
  • International Institute for Population Sciences (IIPS), and Macro International. 2007a. National Family Health Survey (NFHS-3) 2005-06, India: Volume 1. Mumbai: IIPS. (Download in PDF format, 7.9 MB)
  • International Institute for Population Sciences (IIPS), and Macro International. 2007b. National Family Health Survey (NFHS-3) 2005-06, India: Volume II. Mumbai: IIPS. (Download in PDF format, 4.1 MB)
Related articles
External links
Friedrich Huebler, 20 January 2008 (edited 12 October 2008), Creative Commons License
Permanent URL: http://huebler.blogspot.com/2008/01/secondary-school-attendance-in-india-in.html