Compared to other regions, educational attainment in sub-Saharan Africa is relatively low but there are large variations between individual countries. The graph and table below present data from the UNESCO Institute for Statistics (UIS), published in the Global Education Digest 2011. The values for each country indicate which percentage of the population aged 25 years and older completed at least primary, lower secondary, upper secondary, post-secondary, or tertiary education. For example, in Seychelles, 90% of the adult population completed at least primary education, 67% at least lower secondary education, and 44% at least upper secondary education. At the other end of the distribution is Burkina Faso, where only 5% of the adult population completed at least primary education and only 2% at least lower secondary education.
Sub-Saharan Africa: Population 25 years and older by minimum level of education

Source: UNESCO Institute for Statistics, Global Education Digest 2011, Table 19. - Click image to enlarge.
Among the 15 countries in sub-Saharan Africa for which UIS has data, only seven - Kenya, Mauritius, Namibia, Seychelles, South Africa, Tanzania, and Zimbabwe - have attainment rates for primary education at or above 50%. In the remaining eight countries with data - Benin, Burkina Faso, Chad, Lesotho, Malawi, Mali, Senegal, and Uganda - less than half of the population 25 years and older completed at least primary education. For Benin, the share of the population with completed primary education is unknown because the country reported combined figures for incomplete and complete primary education; 16% of the population attended primary education with or without completing that level (see Global Education Digest 2011, Table 18).
Similar to the attainment rates for primary education, attainment rates for other levels of education also vary widely between individual countries. The proportion of the population that completed at least lower secondary education ranges from 2% in Burkina Faso to 70% in South Africa. For upper secondary education, the attainment rates range from 0.5% in Burkina Faso to 44% in Seychelles. Not more than 0.5% of the adult population completed post-secondary education in Burkina Faso and Malawi, compared to 12% in South Africa. Completed tertiary education is uncommon among the population 25 years and older in sub-Saharan Africa. Only one country, Seychelles, has an attainment rate for tertiary education greater than 3%.
Sub-Saharan Africa: Population 25 years and older by minimum level of education
| Country | Year | Level of education (%) | ||||
| Primary | Lower secondary | Upper secondary | Post- secondary | Tertiary | ||
| Benin | 2002 | . | 14.3 | . | 2.2 | 2.2 |
| Burkina Faso | 2007 | 5.2 | 2.0 | 0.5 | 0.3 | 0.2 |
| Chad | 2004 | 8.5 | 5.5 | . | 3.2 | 3.2 |
| Kenya | 2010 | 59.4 | 41.9 | 36.3 | 6.3 | 0.0 |
| Lesotho | 2008 | 40.9 | 20.9 | 13.8 | 5.4 | 1.9 |
| Malawi | 1998 | 19.8 | 8.6 | 5.2 | 0.5 | 0.5 |
| Mali | 2006 | 18.6 | 10.3 | 5.5 | 1.9 | 1.9 |
| Mauritius | 2000 | 48.9 | 38.9 | 20.3 | 7.9 | 2.6 |
| Namibia | 2001 | 48.5 | 27.7 | 17.0 | 5.3 | 2.2 |
| Senegal | 2006 | 10.7 | 7.5 | 4.9 | 3.2 | 0.8 |
| Seychelles | 2002 | 90.3 | 66.8 | 44.2 | . | 7.4 |
| South Africa | 2009 | 76.4 | 70.4 | 35.7 | 11.8 | 0.7 |
| Tanzania | 2002 | 48.9 | 6.0 | 1.6 | . | 0.9 |
| Uganda | 2008 | 34.6 | 23.4 | 8.7 | 6.8 | 1.8 |
| Zimbabwe | 2002 | 65.1 | 45.9 | 10.3 | 9.1 | 1.5 |
When interpreting the educational attainment data for sub-Saharan Africa it is necessary to consider that the reported values for some countries are more than a decade old. As younger, more educated cohorts reach age 25, the average attainment rates of the population 25 years and older increase and the situation of some countries is therefore likely to have improved since the year of reporting. In addition, the picture is incomplete because for 30 of the 45 countries in the sub-Saharan Africa region, as defined by UIS, no educational attainment data is available in the UIS Data Centre.
Reference
- UNESCO Institute for Statistics (UIS). 2011. Global Education Digest 2011: Comparing Education Statistics Across the World. Montreal: UIS. (Download in PDF format, 7.5 MB)
Related articles
- Global Education Digest 2011
- Adult literacy in sub-Saharan Africa
- Education finance in sub-Saharan Africa
- School attendance by grade and age in Liberia
- Educational attainment in Brazil since 1920
- Educational attainment in India, 1950-2000
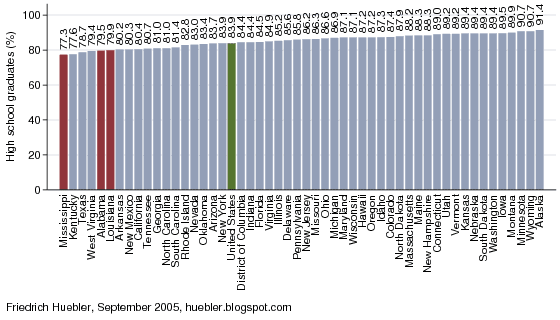
- Educational attainment in the United States, 1940-2009
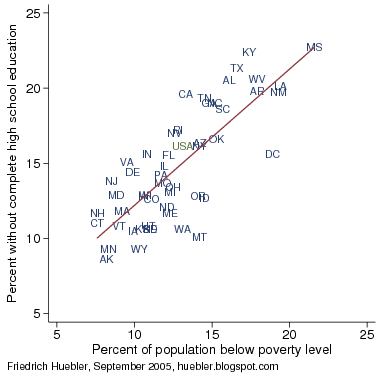
- Poverty and educational attainment in the United States
- Poverty and educational attainment in the United States, part 2
- National wealth and years of education
- Regional disparities in school life expectancy
- Education and democracy
Permanent URL: http://huebler.blogspot.com/2012/02/ssa.html