Showing posts with label USA. Show all posts

Monday, January 3, 2011

Educational attainment in the United States, 1940-2009

In the United States, the level of education of the adult population has increased steadily since the middle of the 20th century. The share of the population 25 years and over who attended college increased from 10 percent in 1940 to 56 percent in 2009. 30 percent of the population in this age group had completed 4 or more years of college in 2009. The share of the population with only elementary education or no formal schooling fell from 60 percent in 1940 to 6 percent in 2009. High school reached its peak as the most common level of education in the 1970s and 1980s, with a share around 50 percent, but younger cohorts are more likely to continue their education at the post-secondary level.

This increase in educational attainment of the work force has contributed to a strengthening of U.S. competitiveness in the global economy. At the same time, the increased demand for highly skilled workers emphasizes the importance of secondary and higher education for individuals in search of employment.

The trends in years of schooling of the adult U.S. population from 1940 to 2009 are visualized in the figure below. The table that follows lists data for selected years. The data on educational attainment were collected with the Current Population Survey (CPS), a joint survey by the Bureau of Labor Statistics and the Census Bureau that has been conducted since 1940.

Years of school completed by population 25 years and over, 1940-2009
Graph with trends in educational attainment in the United States from 1940 to 2009
Source: U.S. Census Bureau, September 2010

Years of school completed by population 25 years and over, 1940-2009
Years of school Percent of population
1940 1950 1960 1970 1980 1990 2000 2009
0 to 4 years elementary school 13.5 10.8 8.3 5.3 3.4 2.4 1.6 1.4
5 to 8 years elementary school 46.0 36.1 31.4 22.4 14.1 8.8 5.4 4.1
1 to 3 years high school 15.0 16.9 19.2 17.1 13.9 11.2 8.9 7.9
4 years high school 14.1 20.1 24.6 34.0 36.8 38.4 33.1 31.1
1 to 3 years college 5.4 7.1 8.8 10.2 14.9 17.9 25.4 26.1
4 or more years college 4.6 6.0 7.7 11.0 17.0 21.3 25.6 29.5
Source: U.S. Census Bureau, September 2010

Data source
Related articles
External links
Friedrich Huebler, 3 January 2011, Creative Commons License
Permanent URL: http://huebler.blogspot.com/2011/01/usa.html

Saturday, May 9, 2009

Achievement gap between black and white students in the United States

Two previous articles on this site presented data on disparities in school attendance by ethnicity, language or religion from 17 nationally representative household surveys. Net attendance rates among the least disadvantaged groups are up to 1.7 times higher than net attendance rates among the most disadvantaged groups at the primary level of education and up to 6 times higher at the secondary level of education.

Similar gaps in access to education and in student achievement exist in the United States. The National Center for Education Statistics has published the most recent findings of its National Assessment of Educational Progress, a long term study of student achievement, in the report NAEP 2008 Trends in Academic Progress. The results of the periodic assessments by the NCES demonstrate a persistent achievement gap between black and white students.

Figure 1 summarizes the results of 12 reading assessments over the period 1971 to 2008. For each assessment, the average reading scores of black and white students aged 9, 13 and 17 years are plotted in the graph. The shaded area indicates the achievement gap between black and white students. For 2004, two scores are shown for each group because the assessment format was revised in that year. The reading scores in 1971 and 2008 are also listed in Table 1.

Figure 1: Average reading scores of black and white students, 1971-2008
Trendlines with reading scores of black and white students in the United States between 1971 and 2008
Data source: NAEP 2008 Trends in Academic Progress, p. 14-15.

Black and white students of all ages achieved higher reading scores in 2008 than in previous years. In 1971, 9-year-old white students had an average score of 214 and black students in the same age group scored 170 on average. In 2008, the average score of 9-year-olds was 228 for white students and 204 for black students. As a result, the score gap between black and white 9-year-olds fell from 44 in 1971 to 24 in 2008. For 13-year-old students the score gap fell from 39 to 21 over the same period and for 17-year-olds it fell from 52 to 29.

Closer inspection of the data reveals that most of this reduction in the achievement gap occurred during the 1970s and 1980s. Since the 1990s, the gap between black and white students has remained relatively stable. Although the reading scores of black students continue to improve, they no longer grow fast enough to close the gap with white students.

Table 1: Average reading scores of black and white students, 1971 and 2008
Year Age Average reading score Score gap
Black White
1971 9 years 170 214 44
2008 9 years 204 228 24
1971 13 years 222 261 39
2008 13 years 247 268 21
1971 17 years 239 291 52
2008 17 years 266 295 29
Data source: NAEP 2008 Trends in Academic Progress, p. 14-15.

The NAEP report shows a similar achievement gap between black and white students in the area of mathematics. In addition, there is a similar but smaller gap between white and Hispanic students in reading and mathematics. In spite of long-running efforts to improve the education system for all parts of the population, minority students consistently lag behind white students in the United States.

Reference
  • Rampey, Bobby D., Gloria S. Dion, and Patricia L. Donahue. 2009. NAEP 2008 Trends in Academic Progress. Washington: National Center for Education Statistics, Institute of Education Sciences, U.S. Department of Education. (Download PDF file, 1.1 MB)
Related articles
External links
Friedrich Huebler, 9 May 2009, Creative Commons License
Permanent URL: http://huebler.blogspot.com/2009/05/usa.html

Sunday, September 11, 2005

Poverty and educational attainment in the United States, part 2

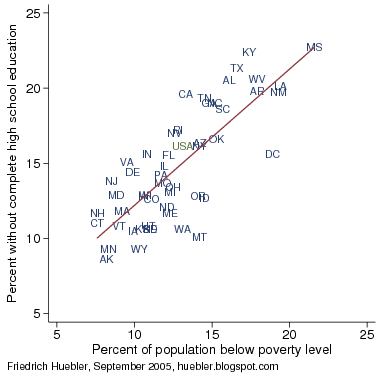
Poverty and education are closely linked. In India, for example, children from the poorest households are least likely to attend primary school. Such a link between poverty and education also exists in industrialized countries. In the United States, the states with the highest poverty rates are also those with the lowest share of high school graduates. The graph below plots the percent of the population living below the poverty level against the percent of the population above 25 years of age without complete high school education. The data is from the 2004 American Community Survey and all states are marked with their U.S. postal abbreviation.

Percent of population below poverty level and percent of population 25 years and over who did not graduate from high school, United States 2004
Scatter plot with percent of population below poverty level and percent who did not complete high school, United States 2004
Data source: 2004 American Community Survey.

The regression line emphasizes the close link between poverty and lack of education in the United States. Mississippi has the poorest and least educated population, with 22 percent living below the poverty level and 23 percent not having graduated from high school. Other states with a low share of high school graduates and high poverty rates are Alabama, Arkansas, Kentucky, Louisiana, New Mexico, Texas, and West Virginia. In contrast, Alaska, Connecticut, Minnesota, and New Hampshire have the least poor and most educated population in the United States. In the country as a whole, 13 percent of the population live below the poverty level and 16 percent did not graduate from high school.

Related articles
Friedrich Huebler, 12 September 2005 (edited 9 May 2009), Creative Commons License
Permanent URL: http://huebler.blogspot.com/2005/09/poverty-and-educational-attainment-in_12.html

Sunday, September 4, 2005

Poverty and educational attainment in the United States

On August 29, 2005, hurricane Katrina, possibly the deadliest storm in U.S. history, caused extensive damage in the southeastern United States. The victims of Katrina tended to be black, poor and less educated and many did not have the means to leave the area before the storm arrived.

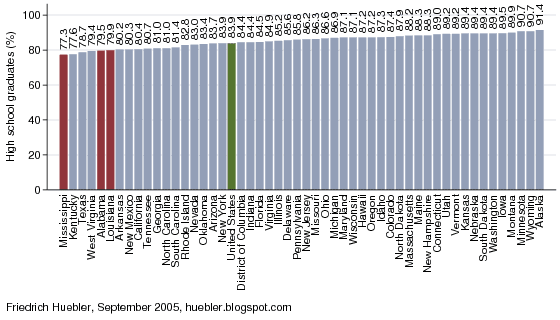
Alabama, Louisiana and Mississippi, the states that were particularly hard hit, are among the poorest in the nation, according to data from the 2004 American Community Survey by the U.S. Census Bureau. In Mississippi, 21.6% of the population lived below the poverty line, more than in any other U.S. state. Louisiana was the second poorest state, with 19.4% of the population living below the poverty line. Alabama was the ninth poorest of the 50 states, with 16.1% below the poverty line. New Orleans, the city with the highest number of storm victims, had a poverty rate of 23.2%. In comparison, 13.1% of the entire U.S. population lived below the poverty line in 2004. In terms of education, the three states affected most by the hurricane also rank near the bottom of the 50 U.S. states, as the graph below shows.

Percent of population 25 years and over who graduated from high school, United States 2004
Bar chart with percent of population who completed high school, United States 2004
Data source: 2004 American Community Survey.

The 2004 American Community Survey found that 83.9% of the U.S. population aged 25 years and over graduated from high school, which means that they have at least 12 years of education. In the graph above, the states are ranked by the share of the population who completed high school. Mississippi had the lowest percentage of high school graduates, 77.3%. Alabama with 79.5% and Louisiana with 79.9% rank fifth and sixth in terms of the lowest share of high school graduates.

The victims of hurricane Katrina are mostly from the margins of U.S. society, poor, with little education and limited economic opportunities. Local, state and national government agencies have the responsibility to assist those in need but there has been widespread criticism of the government's slow response to the disaster. Many survivors have lost their homes and other belongings and are unable to provide for themselves. They will depend on help from the government and charitable organizations like the Red Cross for many months and years to come.

Related articles
Friedrich Huebler, 4 September 2005 (edited 9 May 2009), Creative Commons License
Permanent URL: http://huebler.blogspot.com/2005/09/poverty-and-educational-attainment-in.html