Sunday, April 16, 2006

Primary school attendance in Bolivia

Bolivia, one of the poorest nations in Latin American, is the only country from that region among UNICEF's 25 priority countries for girls' education. In 2005, the population of Bolivia was estimated at 9.1 million, including 1.4 million children of primary school age (6 to 11 years).

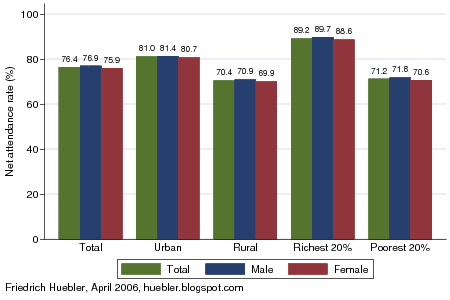
A Demographic and Health Survey (DHS) was carried out in Bolivia in 2003/04. This nationally representative household survey collected data in various areas, including education. According to the survey results, the primary school net attendance rate (NAR) is 76.4 percent. The primary school NAR is the share of children of primary school age that are attending primary school. In Bolivia, one in four children of primary school age are thus not in primary school according to the DHS.

Bolivia is not close to the Millennium Development Goal (MDG) of universal primary education, but the goal of gender parity has been reached. With 75.9 percent, the primary school NAR of girls is almost the same as that of boys, 76.9 percent. The gender parity index (GPI), the ratio of female to male NAR, is 0.99. The NAR values are shown in the graph and table below.

Primary school net attendance rate, Bolivia 2003/04
Bar chart with total, male and female primary school net attendance rate in Bolivia, 2003/04
Data source: Bolivia 2003/04 DHS.

There is no gender disparity in Bolivia but disparities exist at other levels. Children in urban areas have a higher primary school NAR (81.0 percent) than children in rural areas (70.4 percent). Household wealth is strongly associated with school attendance. In the richest 20 percent of all households, 89.2 percent of all children of primary school age attend primary school. In the poorest 20 percent of all households, the primary school NAR is 71.2 percent. Raising attendance rates among the rural population and among the poor remains a challenge in Bolivia.

Primary school net attendance rate, Bolivia 2003/04

Total
NAR (%)
Male NAR (%)Female NAR (%)Difference
male- female
GPI
female/ male
Urban81.081.480.70.70.99
Rural70.470.969.91.00.99
Richest 20%89.289.788.61.00.99
Poorest 20%71.271.870.61.20.98
Total76.476.975.91.00.99
GPI: gender parity index. - Data source: Bolivia 2003/04 DHS.

Related articles
Friedrich Huebler, 16 April 2006 (edited 30 June 2006), Creative Commons License

Thursday, April 13, 2006

Update to "Creating maps with Stata"

The guide to Creating maps with Stata has been updated. Users of Stata 9.1 or a more recent version can now convert shapefiles directly to Stata format with a new program called shp2dta. Read the guide to learn more.

Related articles
Friedrich Huebler, 13 April 2006, Creative Commons License

Monday, March 27, 2006

Primary completion rate 2002/03

Goal 2 of the United Nations Millennium Development Goals (MDG) is to "ensure that, by 2015, children everywhere, boys and girls alike, will be able to complete a full course of primary schooling." This site has published data for several indicators that are related to this goal, among them the primary school net enrollment ratio (NER). In countries where children begin their education at the official primary school entrance age and graduate at the official graduation age, the primary NER is a good indicator of primary school completion. If many children in a country enter school late or if repetition rates are high, on the other hand, the primary NER underestimates the participation of children in the education system. The primary completion rate has been suggested by the World Bank as a better indicator for progress toward MDG 2.

Definition: "The primary completion rate is the ratio of the total number of students successfully completing (or graduating from) the last year of primary school in a given year to the total number of children of official graduation age in the population." (United Nations Development Group. 2003. Indicators for monitoring the Millennium Development Goals: Definitions, rationale, concepts and sources. New York: United Nations.)
  • Primary completion rate = Number of primary school graduates / Number of children of primary school graduation age
The UNESCO Institute for Statistics (UIS) publishes a proxy indicator for the primary completion rate under the name "gross intake rate to the last grade of primary". In the Global Education Digest 2005, this indicator is defined as follows: "Total number of new entrants in the last grade of primary education, regardless of age, expressed as a percentage of the population of the theoretical entrance age to the last grade." The number of new entrants is the total number of children in the last grade of primary school minus the number of repeaters.
  • Gross intake rate to last grade of primary = (Number of children in last primary grade – Number of repeaters) / Number of children of entrance age to last primary grade
While the calculation methods of the World Bank and UNESCO are different, they yield similar values. The World Bank publishes its estimates for the primary completion rate in the World Development Indicators database. UNESCO's estimates are published in the Global Education Digest 2005. The World Bank has data for 169 countries and the UNESCO Institute for Statistics for 166 countries. In the analysis that follows I refer to data from the UIS because the reported values are on average more recent than the values published by the World Bank.

The map below indicates the primary completion rate in each country for which data was available. The top group includes all countries with a primary completion rate at or above 90 percent. The primary completion rate can have values above 100 percent, which can be a symptom of late entry, grade repetition, or of an enrollment push at some point in the past, perhaps as a consequence of a school enrollment campaign. In the UIS database, 38 countries have values above 100 percent but in the long run the primary completion rate can be expected to stabilize at 100 percent.

Primary completion rate, 2002/2003
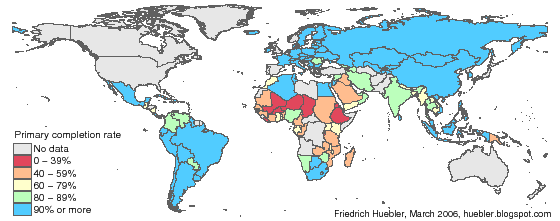
Map of the world showing primary completion rate for each country in 2002/03
Data source: UNESCO Institute for Statistics (UIS). 2005. Global Education Digest 2005. Montreal: UIS.

In ten countries, all in sub-Saharan Africa, the primary completion rate is below 40 percent: Burkina Faso, Burundi, Chad, Djibouti, Eritrea, Ethiopia, Guinea-Bissau, Liberia, Mali, and Niger. In 19 countries, the primary completion rate is between 40 and 59 percent, in 20 it is between 60 and 79 percent, and in 26 countries it is between 80 and 89 percent. 91 countries have primary completion rates at or above 90 percent.

The global average for the primary completion rate is 84.5 percent (see the table below). Boys (86.4 percent) are more likely to complete their primary education than girls (82.3 percent). When countries are grouped by UNICEF region, the highest primary completion rates are observed in industrialized countries (100.5 percent), Latin America and the Caribbean (97.2 percent), East Asia and the Pacific (96.6 percent), and in Eastern Europe and the Commonwealth of Independent States (93.8 percent). Countries in these regions have already reached or are close to the goal of universal primary education.

Lower primary completion rates are observed in Eastern and Southern Africa (59.5 percent), West and Central Africa (64.8 percent), the Middle East and North Africa (75.4 percent), and South Asia (81.6 percent). The biggest gender disparity exists in West and Central Africa, where the primary completion rate of boys is 14.6 percent above that of girls. High gender gaps also exist in Eastern and Southern Africa (7.6 percent), the Middle East and North Africa (7.5 percent), and South Asia (6.3 percent). Latin America and the Caribbean is the only region where girls are more likely to complete primary education than boys, but the gap is relatively small (2.6 percent).

Primary completion rate, 2002/03
RegionPrimary completion rate (%)
MaleFemaleTotal
East Asia, Pacific96.696.696.6
Eastern and Southern Africa63.355.759.5
Eastern Europe, CIS96.795.493.8
Industrialized countries100.7100.7100.5
Latin America, Caribbean95.998.597.2
Middle East, North Africa79.071.575.4
South Asia84.678.381.6
West and Central Africa72.057.464.8
World86.482.384.5
Data source: UNESCO Institute for Statistics (UIS). 2005. Global Education Digest 2005. Montreal: UIS.
Note: Regional values are weighted by each country's population of primary school age.


Friedrich Huebler, 27 March 2006, Creative Commons License
Saturday, February 18, 2006

115 million children out of school

Cover of UNESCO-UNICEF publication on children out of schoolThe number of children out of school is an important indicator to track progress toward the Millennium Development Goal of universal primary education. According to a joint report by the UNESCO Institute for Statistics and UNICEF that was published this week, 115 million children of primary school age are not in school.
The report with the title Children out of school: Measuring exclusion from primary education describes a new approach to measure the number of children out of school. Typically, the number of children out of school is based on the primary school net enrollment rate (NER), which is calculated as follows:

Primary school NER = number of children of primary school age enrolled in primary school / number of children of primary school age

The share of children out of school is assumed to be the difference between the theoretical NER at full enrollment and the current NER:

Share of children out of school = 100% - primary school NER

In many countries some children of primary school age are already attending secondary school and these children are mistakenly counted as out of school if the formula above is used. The report by UNESCO and UNICEF relies on an improved method that counts children of primary school age who are attending primary or secondary school. Children of primary school age who are still in preschool or who are in non-formal education (for example religious schools) are counted as out of school because they are not receiving the education they should get at their age.

The report also breaks new ground because it evaluates both administrative data on enrollment and attendance data from household surveys. UNESCO publications like the Global Education Digest usually only evaluate data from administrative records that are provided by national governments. Data from 80 household surveys allowed the authors to fill gaps in the administrative data and made it possible to explore the child and household characteristics associated with schooling status. The report finds, for example, that children from the poorest household quintile are three times as likely to be out of school as children from the richest quintile. A detailed appendix has statistics on children out of school for all countries. The data is mostly for the 2001/02 school year, the latest year with data at the time the report was written.

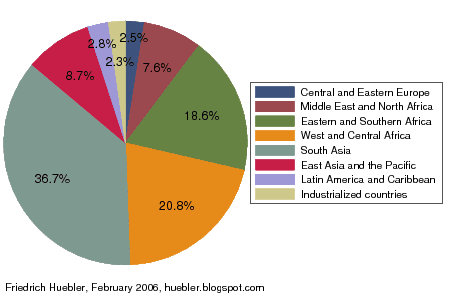
Regional distribution of children out of school, 2001/02
Pie chart showing regional distribution of children out of school
Data source: UNESCO Institute for Statistics (UIS). 2005. Children out of school: Measuring exclusion from primary education. Montreal: UIS. Table 1.1, page 18.

The majority of the 115 million children out of school live in Sub-Saharan Africa, as the graph above shows. 24.0 million (20.8 percent of the total) live in West and Central Africa and another 21.4 million (18.6 percent) in Eastern and Southern Africa. South Asia is home to 42.3 million or 36.7 percent of all children out of school. 10.0 million children not in school (8.7 percent) live in East Asia and 8.8 million (7.6 percent) in the Middle East and North Africa. The remaining regions have relatively high primary school enrollment rates and are therefore home to fewer children out of school. Latin America and the Caribbean contribute 3.3 million (2.8 percent) of the global population of children out of school, 2.9 million (2.5 percent) live in Central and Eastern Europe and 2.6 million (2.3 percent) in the industrialized countries. The regional groupings are those used by UNICEF (see the map in an article on regional trends in primary school enrollment).
Related articles
Friedrich Huebler, 18 February 2006 (edited 20 March 2006), Creative Commons License

Sunday, February 5, 2006

Maps with international education statistics

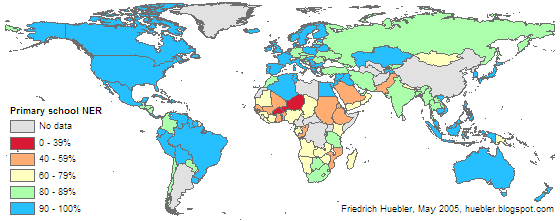
Maps are a powerful tool to visualize statistics. This site uses maps for cross-country comparisons of data like national primary school enrollment rates, shown in the map below.

Primary school net enrollment rate, 2002/2003
Map of the world showing primary school net enrollment rate for each country in 2002/03
Data source: UNESCO Institute for Statistics (UIS). 2005. Global Education Digest 2005. Montreal: UIS.

Here is a list of articles on this site that include maps with international education statistics:
My recently updated guide to creating maps with Stata shows how the Stata statistical package and its tmap module can be used to create these and other maps.

Friedrich Huebler, 5 February 2006 (edited 30 March 2006), Creative Commons License

Saturday, January 21, 2006

Household wealth and school attendance in Nigeria

In 2003, a Demographic and Health Survey (DHS) was conducted in Nigeria. This nationally representative household survey collected data on household characteristics, education, maternal and child health, family planning, and other indicators. The survey has no data on household income but with the information on assets owned by a household - for example, water supply, sanitation facilities, housing material, radio, telephone, refrigerator, bicycle, automobile, and livestock - it is possible to generate an index of relative household wealth (Filmer and Pritchett 2001). With this index, the link between wealth and the level of education of each household member can be analyzed.

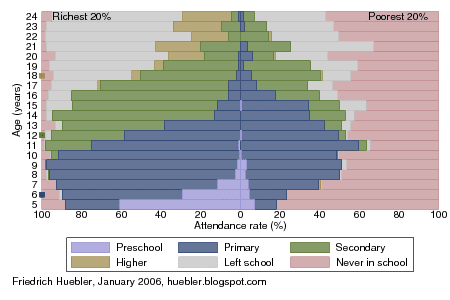
The primary school age in Nigeria is 6 to 11 years and the secondary school age 12 to 17 years. As I showed in previous posts, the primary school net attendance rate (NAR) in Nigeria is 60.1% and the secondary school NAR 35.1%. This means that 60.1% (35.1%) of all children of primary (secondary) school age were attending primary (secondary) school at the time of the survey. Attendance rates are higher for boys compared to girls and for urban residents compared to rural residents. Household wealth is also strongly linked to school attendance, as the graph below demonstrates.

School attendance by age and household wealth, Nigeria 2003
Graph with level of school attended by age and household wealth in Nigeria, 2003
Data source: Nigeria 2003 DHS.

The graph is constructed as two back-to-back bar graphs, similar to a population pyramid, but the two halves don't indicate age and sex but age and household wealth. The left half has the school attendance rates of the richest 20% of all households in Nigeria, as identified with the wealth index, and the right half the attendance rates of the poorest 20%. Only the population aged 5 to 24 years of age is covered because the DHS did not collected data on current school attendance for other ages. The population is divided into six groups:
  • currently attending preschool (purble bars)
  • currently attending primary school (blue bars)
  • currently attending secondary school (green bars)
  • currently attending higher education (brown bars)
  • attended school in the past but no longer in school (gray bars)
  • never attended school (red bars)
It is immediately obvious that only half of all children in the poorest 20% of the population ever attend school. In the richest 20%, on the other hand, almost everyone is currently in school or attended school in the past. For the population aged 5 to 24 years as a whole, 52.8% from the poorest quintile never attended school, while only 4.4% from the richest quintile never attended school.

In addition, those from wealthy households are much more likely to attend primary and secondary school at the proper age. The blue, green and brown markers along the left axis indicate the official starting ages of primary, secondary and tertiary education: 6, 12 and 18 years, respectively. Children from the poorest 20% of the population typically enter primary school much later than those from the richest 20% - if they attend school at all - and they typically do so without the advantage of having been in preschool first. Those from the richest households are also more likely to continue their education at the secondary or tertiary level.

In conclusion, to reach the Millennium Development Goal of universal primary education, Nigeria clearly has to target the poorest part of its population.

References: Filmer, Deon, and Lant H. Pritchett. 2001. Estimating wealth effects without expenditure data - or Tears: An application to educational enrollments in states of India. Demography 38 (1), February: 115-132.

Related articles:
- Primary school attendance in Nigeria
- Secondary school attendance in Nigeria
- Age and level of education in Nigeria
- Education data from household surveys


Friedrich Huebler, 21 January 2006, Creative Commons License

Tuesday, December 13, 2005

Age and level of education in Nigeria

According to data from a Demographic and Health Survey (DHS) that was conducted in Nigeria in 2003, 60.1% of all children of primary school age were attending primary school at the time of the survey. Among children of secondary school age, 35.1% were attending secondary school.

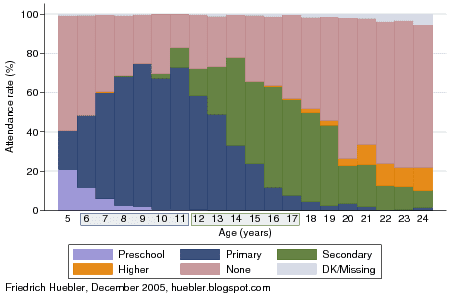
These primary and secondary school net attendance rates hide the fact that many children are in school at a level that is not appropriate for their age. In Nigeria, children often enter school at an advanced age and leave school well past the official graduation age. The primary school age in Nigeria is 6 to 11 years and the secondary school age 12 to 17 years. The graph below indicates the level of school attended for all Nigerians between 5 and 24 years of age. The data from the 2003 DHS survey reveals that a small percentage of Nigerians are still in primary school when they are already 20 years old. Secondary school attendance continues past 24 years of age, the highest age for which the DHS has data on current school attendance.

Level of school attended by age, Nigeria 2003
Bar chart with level of school attended by age in Nigeria, 2003
Data source: Nigeria 2003 DHS.

Only 36.6% of all 6-year-olds were attending primary school at the time of the survey. Primary school attendance reaches its peak between 9 and 11 years of age, when around 72% of all children are in primary school. At 17 years, the official graduation age from secondary school, 7.8% of all children were still in primary school.

Among 12-year-olds, only 13.9% were attending secondary school, with other children just beginning to attend primary school. Secondary school attendance reaches its peak at 16 years of age, when 51.3% of all children are in secondary school. At 24 years, 8.7% of the population were still in secondary school.

Delayed entry into the education system is a problem that exists in many other African countries. One indicator of this is that gross enrollment rates exceed net enrollment rates by a large margin in most of Sub-Saharan Africa. The repercussions of starting school late can be severe: such children are more likely to drop out from school and to enter the labor market with limited qualifications, reducing their potential to live productive lives. At the national level, having a less educated population makes it more difficult for countries to escape from poverty. Nigeria is therefore among the countries that are struggling to reach the Millennium Development Goals of universal primary education and eradication of extreme poverty and hunger.

Related articles:
- Primary school attendance in Nigeria
- Secondary school attendance in Nigeria
- Household wealth and school attendance in Nigeria
- Primary school gross and net enrollment
- Education data from household surveys


Friedrich Huebler, 14 December 2005 (edited 21 January 2006), Creative Commons License