Showing posts with label Nigeria. Show all posts

Friday, April 30, 2010

Age distribution by wealth quintile in household survey data

Household survey data may not contain precise ages for all household members. Age heaping, an unusually high share of ages ending in 0 and 5, is especially common in survey data from developing countries. Age heaping can be caused by uncertainty of survey respondents about their own age or the age of other household members, intentional misreporting, or errors during data collection and processing. Errors in age data can affect the estimation of education indicators from household survey data because these indicators are often calculated for specific age groups. Examples include the youth literacy rate and school attendance rates for the population of primary and secondary school age.

An article on age distribution in household survey data on this site demonstrated age heaping in survey data from India, Nigeria and to a lesser extent Indonesia. Data for Brazil showed little to no age heaping. To investigate whether age heaping is more common among certain segments of the population, the survey samples can be disaggregated by household wealth quintile. For this purpose, the households in the sample are first ranked by wealth, from poorest to richest. The population is then divided into five equally sized groups with 20 percent each of all household members in the sample.

Figure 1 shows the age distribution by single year of age and wealth quintile in data from Brazil. The data were collected in 2006 with a Pesquisa Nacional por Amostra de DomicĂ­lios (PNAD) or National Household Sample Survey. No preference for ages ending in 0 and 5 could be observed for the entire survey sample combined and disaggregation does not change the result. The age distribution in each quintile is smooth, with no peaks at ages ending in 0 and 5. The only obvious difference between the population in the different quintiles is that poorer families tend to have more children, indicated by a peak in the age distribution in the younger age groups.

Figure 1: Age distribution in household survey data by single-year age group and household wealth quintile, Brazil
Line graph with age distribution in survey data from Brazil by single-year age group and household wealth quintile
Data source: Brazil PNAD 2006.

Figure 2 shows the age distribution in Demographic and Health Survey (DHS) data from India. The data were collected in 2005-06. In contrast to Brazil, there is considerable age heaping in the Indian data. However, peaks around ages ending in 0 and 5 are more pronounced among poorer households. Increasing household wealth is associated with a decrease in age heaping.

Figure 2: Age distribution in household survey data by single-year age group and household wealth quintile, India
Line graph with age distribution in survey data from India by single-year age group and household wealth quintile
Data source: India DHS 2005-06.

Data from Indonesia, collected with a Demographic and Health Survey in 2007, are shown in Figure 3. At the aggregate level, the survey data from Indonesia exhibit little age heaping. However, disaggregation by wealth quintile reveals that reported ages ending in 0 and 5 are more common among poorer households.

Figure 3: Age distribution in household survey data by single-year age group and household wealth quintile, Indonesia
Line graph with age distribution in survey data from Indonesia by single-year age group and household wealth quintile
Data source: Indonesia DHS 2007.

Finally, Figure 4 displays data from a 2008 Demographic and Health Survey in Nigeria. Similar to India, there is a high percentage of ages ending in 0 and 5 in the combined survey sample. The disaggregated data show that age heaping occurs more frequently among poorer households but also exists in the richest wealth quintile.

Figure 4: Age distribution in household survey data by single-year age group and household wealth quintile, Nigeria
Line graph with age distribution in survey data from Nigeria by single-year age group and household wealth quintile
Data source: Nigeria DHS 2008.

Disaggregation of household survey data from Brazil, India, Indonesia and Nigeria has shown that age heaping occurs more frequently in data collected from poorer households. Wealthier households may have more access to birth registration and therefore may be able to verify their ages with birth certificates. Wealthier households are also likely to be smaller and survey respondents would therefore have to know and report the ages of fewer persons than respondents from larger households.

Age heaping in survey data reduces the accuracy of education indicators that are calculated for single years of age, for example for all children of primary school entrance or graduation age. However, indicator estimates for larger age groups, for example all children of primary or secondary school age, are less likely to be affected by errors in age data.

Related articles
External links
Friedrich Huebler, 30 April 2010, Creative Commons License
Permanent URL: http://huebler.blogspot.com/2010/04/age.html

Sunday, February 28, 2010

Age distribution in household survey data

Indicators in the field of education statistics, such as those defined in the education glossary of the UNESCO Institute for Statistics, are typically calculated for specific age groups. For example, the youth literacy rate is for the population age 15 to 24 years, the adult literacy rate for the population age 15 and over, and the net attendance rates for primary and secondary education are for the population of primary and secondary school age, respectively. The net intake rate is an example for an indicator that is calculated for a single year of age, the official start age of primary school.

For a correct calculation of education indicators it is necessary to have precise age data. In the case of data collected with population censuses or household surveys this means that the ages recorded for each household member should be without error. However, census or survey data sometimes exhibit the phenomenon of age heaping, usually on ages ending in 0 and 5. Such heaping or digit preference occurs when survey respondents don't know their own age or the ages of other household members, or when ages are intentionally misreported.

The presence of age heaping can be tested with indices of age preference such as Whipple's index. Heaping can also be detected through visual inspection of the age distribution in household survey data. Figures 1 and 2 summarize the age distribution in survey data from Brazil, India, Indonesia and Nigeria. The data from Brazil were collected with a Pesquisa Nacional por Amostra de DomicĂ­lios or National Household Sample Survey in 2006. The data for the other three countries are from Demographic and Health Surveys conducted between 2005 and 2008.

Figure 1 shows the share of single years of age in the total survey sample. A preference for ages ending in 0 and 5 is strikingly obvious in the data from India and Nigeria. In the data from Indonesia, age heaping is also present, but to a lesser extent than for India and Nigeria. Lastly, the graph for Brazil is relatively smooth, indicating a near absence of age heaping.

Figure 1: Age distribution in survey data by single-year age group
Line graph with age distribution in survey data by single-year age group
Data source: Brazil PNAD 2006, India DHS 2005-06, Indonesia DHS 2007, Nigeria DHS 2008.

In Figure 2, single ages are combined in five-year age groups, from 0-4 years and 5-9 years to 90-94 years and 95 years and over. Compared to Figure 1, the distribution lines are much smoother, including for India and Nigeria. We can conclude that age heaping is problematic for education indicators that are calculated for single years, for example all children of primary school entrance age, but less so for indicators that are calculated for a larger age group, for example all children of primary or secondary school age or all persons over 15 years of age.

Figure 2: Age distribution in survey data by five-year age group
Line graph with age distribution in survey data by five-year age group
Data source: Brazil PNAD 2006, India DHS 2005-06, Indonesia DHS 2007, Nigeria DHS 2008.

Related articles
External links
Friedrich Huebler, 28 February 2010 (edited 30 September 2010), Creative Commons License
Permanent URL: http://huebler.blogspot.com/2010/02/age.html

Saturday, May 10, 2008

Adult literacy in sub-Saharan Africa

Literacy data published by the UNESCO Institute for Statistics (UIS) in 2007 shows that the lowest adult literacy rates are observed in Africa and South Asia. In some countries, fewer than three out of ten adults can read and write. UIS provides national literacy data for two age groups: youths aged 15 to 24 years, and adults aged 15 years and older. A more detailed analysis of literacy is possible with data from household surveys.

Most Demographic and Health Surveys (DHS) collect data on literacy for persons between 15 and 49 years. For male household members, literacy data is sometimes collected up to an age of 54, 59, or 64 years. To assess the degree of literacy, respondents to the survey are asked to read a card with a simple sentence. If a respondent can read the whole sentence, he or she is counted as literate, in accordance with UNESCO's definition of literacy as "the ability to read and write, with understanding, a short simple sentence about one’s everyday life". Recent Multiple Indicator Cluster Surveys (MICS) by UNICEF collect data on literacy with the same method, but only for female household members between 15 and 49 years. MICS surveys are therefore not covered by the analysis that follows.

This article examines data from eight DHS surveys that were carried out in sub-Saharan Africa between 2003 and 2006. The survey data is from Benin (2006), Burkina Faso (2003), Cameroon (2004), Lesotho (2004-05), Niger (2006), Nigeria (2003), Uganda (2006), and Zimbabwe (2005-06). The data can be used to calculate overall literacy rates and also to examine trends over time by comparing literacy rates in different age groups.

The following table lists literacy rates for the male, female, and total population between 15 and 49 years of age. Zimbabwe (85%) and Lesotho (79%) are the countries with the highest literacy rates, followed by Cameroon (63%), Uganda (58%), and Nigeria (55%). In Benin (33%), Burkina Faso (18%), and Niger (13%), adult literacy rates are much lower. In seven of the eight countries there is a large difference between male and female literacy rates. In Benin, Burkina Faso, Cameroon, Niger, Nigeria, and Uganda, more men than women are literate, with a gender gap ranging from 12% to 26%. In Lesotho, the literacy rate of women is 21% greater than the literacy rate of men. In Zimbabwe, the difference between the male and female literacy rate is only 6%.

Adult literacy rate (%), population 15-49 years
Country
Male Female Total
Benin 45.1 21.8 32.6
Burkina Faso 24.3 11.9 17.6
Cameroon 70.6 54.8 62.5
Lesotho 68.8 90.1 79.4
Niger 20.9 7.5 13.2
Nigeria 68.4 42.8 54.9
Uganda 68.6 48.9 58.4
Zimbabwe 87.9 81.5 84.5
Source: Demographic and Health Surveys 2003-2006

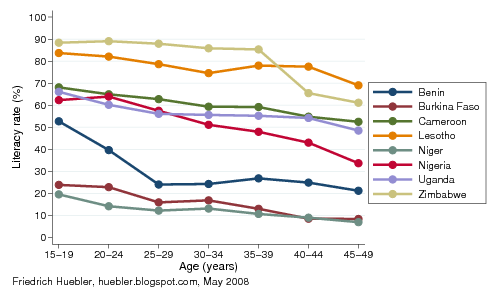
For the graph below, the survey respondents were divided into five-year age groups. In all countries, literacy rates among the younger population are higher than among the older population. The literacy rate of the youngest group, 15 to 19 years, can be interpreted as a measure of the coverage and quality of the primary school system during the 1990s, when the members of this age group were of primary school age.

In Burkina Faso, Cameroon, Lesotho, Niger, and Uganda, the difference between the literacy rates of 15- to 19-year-olds and 45- to 49-year-olds ranges from 13% to 18%. These numbers indicate a relatively modest expansion of the education system between the 1960s, when the older age group was of primary school age, and the 1990s. In contrast, in Benin, Nigeria, and Zimbabwe, the difference between the literacy rates of 15- to 19-year-olds and 45- to 49-year-olds ranges from 27% to 32%. These three countries were thus more successful in their efforts to increase the number of literate citizens than the other five countries.

In Burkina Faso and Niger, less than one quarter of the population between 15 and 19 years can read and write. However, the case of Benin shows that a large increase in literacy can be achieved within only ten years. In Benin, only 24% of 25- to 29-year-olds are literate but among 15- to 19-years-olds the literacy rate has grown to 53%.

Adult literacy by five-year age group
Graph with adult literacy rates by age in sub-Saharan Africa
Source: Demographic and Health Surveys 2003-2006

Related articles

External links

Friedrich Huebler, 10 May 2008, Creative Commons License
Permanent URL: http://huebler.blogspot.com/2008/05/literacy.html

Sunday, April 13, 2008

Reported and tested literacy in Nigeria

Household surveys like the Demographic and Health Surveys (DHS) or the Multiple Indicator Cluster Surveys (MICS) collect data on literacy with various methods. One approach is to simply ask respondents whether they can read and write. In an alternative approach, the reading ability is tested by asking respondents to read a sentence from a card. More detailed assessments of literacy, such as the National Assessment of Adult Literacy in the United States, require in-depth questionnaires that are beyond the scope of surveys like the DHS and MICS.

The Nigeria DHS of 2003 collected literacy data with two methods. First, the survey questionnaire contained the question: "Can (name) read and write in any language with understanding?" This question was asked for all household members aged 5 years and older, with two possible answers: yes or no (NPC and ORC Macro 2004: 247). The results of this literacy assessment were described in the article "Adult literacy in Nigeria", published on this site on 5 April 2008.

Second, a randomly selected subsample of women between 15 and 49 years and men between 15 and 59 years were asked to read a card with a simple sentence in their language. If the respondent could not read the whole sentence, the survey staff were asked to probe if the respondent could read any part of the sentence. The result was recorded as one of three options: (1) cannot read at all, (2) able to read only parts of sentence, or (3) able to read whole sentence. If no card in the respondents' language was available, or if the respondent was blind or visually impaired, the result was recorded in a separate category (NPC and ORC Macro 2004: 26-27).

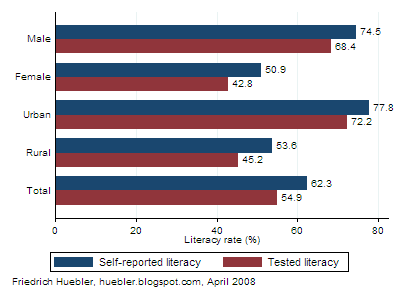
The graph and table below compare the data from the two literacy assessment methods - self-reporting and reading test - for the population aged 15 to 49 years. The self-reported literacy rate, the blue bars in the graph, is the share of respondents that claimed to be able to read and write. The tested literacy rate, the red bars in the graph, is the share of respondents that could read a complete sentence; household members who could only read parts of a sentence were counted as illiterate.

Self-reported and tested literacy in Nigeria, population 15-49 years
Bar graph with self-reported and tested literacy rates in Nigeria
Source: Nigeria Demographic and Health Survey 2003

A comparison of the self-reported and tested literacy rates in Nigeria shows that self-reporting tends to overestimate the degree of literacy in the population. 62 percent of men and women between 15 and 49 years were reported as able to "read and write in any language with understanding". However, the reading test revealed that only 55 percent could read a simple sentence. The difference of 7 percent can be explained by the fact that survey respondents are reluctant to admit that they themselves or other household members, on whose behalf they respond, are unable to read and write. This gap between self-reported and tested literacy can be observed across all groups of respondents: men, women, urban residents, and rural residents. The biggest difference exists in rural areas of Nigeria, were 54 percent of respondents claim to be literate but only 45 percent can in fact read.

Self-reported and tested literacy in Nigeria, population 15-49 years

Self-reported literacy rate (%) Tested literacy rate (%) Difference (%)
Male 74.5 68.4 6.1
Female 50.9 42.8 8.1
Urban 77.8 72.2 5.6
Rural 53.6 45.2 8.4
Total 62.3 54.9 7.4
Source: Nigeria Demographic and Health Survey 2003

References
  • National Population Commission (NPC) [Nigeria] and ORC Macro. 2004. Nigeria Demographic and Health Survey 2003. Calverton, Maryland: National Population Commission and ORC Macro. (Download report, PDF format, 4 MB)
Related articles External linksFriedrich Huebler, 13 April 2008, Creative Commons License
Permanent URL: http://huebler.blogspot.com/2008/04/self-reported-and-tested-literacy-in.html

Saturday, April 5, 2008

Adult literacy in Nigeria

The adult literacy rate is the share of literate persons in the population aged 15 years and older. In Nigeria, a Demographic and Health Survey (DHS) collected data on literacy that can be disaggregated by age, gender, area of residence, and other characteristics. In the survey, conducted in 2003, literacy is defined as the ability to "read and write in any language with understanding" (NPC and ORC Macro 2004: 247). To collect this data, respondents were only asked whether they are literate, but no reading or writing tests were applied. A smaller group of respondents, all women aged 15-49 years and one third of men aged 15-59 years, were asked to read a simple sentence in any of the major language groups of Nigeria (NPC and ORC Macro 2004: 26-27). The literacy rates obtained from this separate reading test were not considered for the analysis that follows, but they are lower than the self-reported literacy rates that cover all survey respondents aged 5 years and older. A separate article on this site describes the difference between self-reported and tested literacy in Nigeria in more detail.

In Nigeria, 55% of the population aged 15 years and older can read and write according to the findings of the DHS. More men (67%) than women (44%) are literate, and the literacy rate is higher in urban (71%) than in rural areas (47%).

Adult literacy rate in Nigeria, 2003
Category
Literacy rate (%)
Male 67.3
Female 43.7
Urban 70.9
Rural 46.8
Total 55.3
Source: Nigeria Demographic and Health Survey 2003

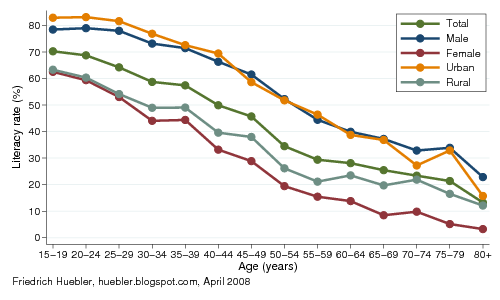
Although almost half of all adult Nigerians cannot read and write, analysis of the survey data by age reveals a steady increase in literacy over the years. Today, more children go to school and learn to read and write than in previous decades. As a result, younger persons are much more likely to be literate than older persons. For the graph below, the survey respondents were divided into 5-year age groups. Among persons aged 15 to 19 years - those who were of primary school age in the 1990s - the literacy rate is 70%. Among persons 80 years or older, only 13% are literate.

A similar rate of increase in the literacy rate can be observed for men, women, urban residents, and rural residents. Among women 80 years or older, only 3% can read and write, compared to 23% of all men in the same age group. Among 15- to 19-year-olds, the female literacy rate is 63% and the male literacy rate 79%. While literacy rates have increased steadily for men and women, there continues to be a large gender gap. A similar gap exists between residents of urban and rural areas.

Adult literacy rate in Nigeria by age, gender and area of residence, 2003
Graph with literacy rates by age, gender and area of residence, Nigeria 2003
Source: Nigeria Demographic and Health Survey 2003

References
  • National Population Commission (NPC) [Nigeria] and ORC Macro. 2004. Nigeria Demographic and Health Survey 2003. Calverton, Maryland: National Population Commission and ORC Macro. (Download report, PDF format, 4 MB)
Related articles

External links

Friedrich Huebler, 5 April 2008 (edited 13 April 2008), Creative Commons License
Permanent URL: http://huebler.blogspot.com/2008/04/adult-literacy-in-nigeria.html

Saturday, January 21, 2006

Household wealth and school attendance in Nigeria

In 2003, a Demographic and Health Survey (DHS) was conducted in Nigeria. This nationally representative household survey collected data on household characteristics, education, maternal and child health, family planning, and other indicators. The survey has no data on household income but with the information on assets owned by a household - for example, water supply, sanitation facilities, housing material, radio, telephone, refrigerator, bicycle, automobile, and livestock - it is possible to generate an index of relative household wealth (Filmer and Pritchett 2001). With this index, the link between wealth and the level of education of each household member can be analyzed.

The primary school age in Nigeria is 6 to 11 years and the secondary school age 12 to 17 years. As I showed in previous posts, the primary school net attendance rate (NAR) in Nigeria is 60.1% and the secondary school NAR 35.1%. This means that 60.1% (35.1%) of all children of primary (secondary) school age were attending primary (secondary) school at the time of the survey. Attendance rates are higher for boys compared to girls and for urban residents compared to rural residents. Household wealth is also strongly linked to school attendance, as the graph below demonstrates.

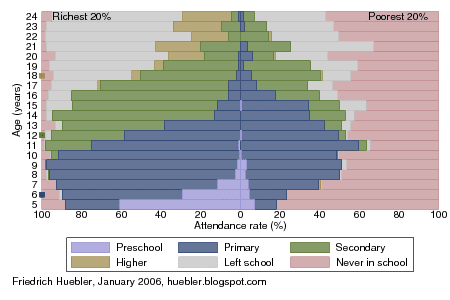
School attendance by age and household wealth, Nigeria 2003
Graph with level of school attended by age and household wealth in Nigeria, 2003
Data source: Nigeria 2003 DHS.

The graph is constructed as two back-to-back bar graphs, similar to a population pyramid, but the two halves don't indicate age and sex but age and household wealth. The left half has the school attendance rates of the richest 20% of all households in Nigeria, as identified with the wealth index, and the right half the attendance rates of the poorest 20%. Only the population aged 5 to 24 years of age is covered because the DHS did not collected data on current school attendance for other ages. The population is divided into six groups:
  • currently attending preschool (purble bars)
  • currently attending primary school (blue bars)
  • currently attending secondary school (green bars)
  • currently attending higher education (brown bars)
  • attended school in the past but no longer in school (gray bars)
  • never attended school (red bars)
It is immediately obvious that only half of all children in the poorest 20% of the population ever attend school. In the richest 20%, on the other hand, almost everyone is currently in school or attended school in the past. For the population aged 5 to 24 years as a whole, 52.8% from the poorest quintile never attended school, while only 4.4% from the richest quintile never attended school.

In addition, those from wealthy households are much more likely to attend primary and secondary school at the proper age. The blue, green and brown markers along the left axis indicate the official starting ages of primary, secondary and tertiary education: 6, 12 and 18 years, respectively. Children from the poorest 20% of the population typically enter primary school much later than those from the richest 20% - if they attend school at all - and they typically do so without the advantage of having been in preschool first. Those from the richest households are also more likely to continue their education at the secondary or tertiary level.

In conclusion, to reach the Millennium Development Goal of universal primary education, Nigeria clearly has to target the poorest part of its population.

References: Filmer, Deon, and Lant H. Pritchett. 2001. Estimating wealth effects without expenditure data - or Tears: An application to educational enrollments in states of India. Demography 38 (1), February: 115-132.

Related articles:
- Primary school attendance in Nigeria
- Secondary school attendance in Nigeria
- Age and level of education in Nigeria
- Education data from household surveys


Friedrich Huebler, 21 January 2006, Creative Commons License

Tuesday, December 13, 2005

Age and level of education in Nigeria

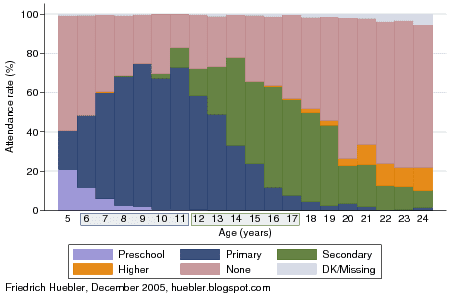
According to data from a Demographic and Health Survey (DHS) that was conducted in Nigeria in 2003, 60.1% of all children of primary school age were attending primary school at the time of the survey. Among children of secondary school age, 35.1% were attending secondary school.

These primary and secondary school net attendance rates hide the fact that many children are in school at a level that is not appropriate for their age. In Nigeria, children often enter school at an advanced age and leave school well past the official graduation age. The primary school age in Nigeria is 6 to 11 years and the secondary school age 12 to 17 years. The graph below indicates the level of school attended for all Nigerians between 5 and 24 years of age. The data from the 2003 DHS survey reveals that a small percentage of Nigerians are still in primary school when they are already 20 years old. Secondary school attendance continues past 24 years of age, the highest age for which the DHS has data on current school attendance.

Level of school attended by age, Nigeria 2003
Bar chart with level of school attended by age in Nigeria, 2003
Data source: Nigeria 2003 DHS.

Only 36.6% of all 6-year-olds were attending primary school at the time of the survey. Primary school attendance reaches its peak between 9 and 11 years of age, when around 72% of all children are in primary school. At 17 years, the official graduation age from secondary school, 7.8% of all children were still in primary school.

Among 12-year-olds, only 13.9% were attending secondary school, with other children just beginning to attend primary school. Secondary school attendance reaches its peak at 16 years of age, when 51.3% of all children are in secondary school. At 24 years, 8.7% of the population were still in secondary school.

Delayed entry into the education system is a problem that exists in many other African countries. One indicator of this is that gross enrollment rates exceed net enrollment rates by a large margin in most of Sub-Saharan Africa. The repercussions of starting school late can be severe: such children are more likely to drop out from school and to enter the labor market with limited qualifications, reducing their potential to live productive lives. At the national level, having a less educated population makes it more difficult for countries to escape from poverty. Nigeria is therefore among the countries that are struggling to reach the Millennium Development Goals of universal primary education and eradication of extreme poverty and hunger.

Related articles:
- Primary school attendance in Nigeria
- Secondary school attendance in Nigeria
- Household wealth and school attendance in Nigeria
- Primary school gross and net enrollment
- Education data from household surveys


Friedrich Huebler, 14 December 2005 (edited 21 January 2006), Creative Commons License

Tuesday, November 15, 2005

Secondary school attendance in Nigeria

Nigeria is the country with the largest population in Africa, estimated at 130 million in 2005. The most recent education data for Nigeria was collected in a Demographic and Health Survey (DHS) in 2003. 60.1% of all children of primary school age were attending primary school at the time of the survey.

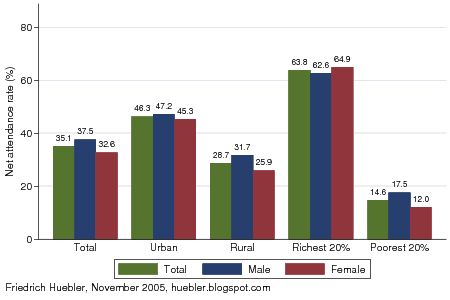
Far fewer children continue their education at the secondary level. The official secondary school age in Nigeria is 12 to 17 years and 35.1% of the children in this age group were in secondary school according to the DHS. For boys the secondary school net attendance rate (NAR) was 37.5% and for girls it was 32.6%.

Secondary school net attendance rate, Nigeria 2003
Bar chart with total, male and female secondary school net attendance rate in Nigeria, 2003
Data source: Nigeria 2003 DHS.

The attendance rate is strongly linked to household wealth and area of residence. 63.8% of children from the richest 20% of all households were in secondary school, compared to only 14.6% of children from the poorest 20% of all households. The secondary school NAR in urban areas was 46.3% and in rural areas it was 28.7%.

At the country level, the secondary school NAR of girls was 4.9% below the male NAR. This gender disparity is a result of lower attendance rates among girls in rural areas and in poor households. In urban Nigeria, the difference between male and female attendance rates was 1.9% and the gender parity index (GPI, the ratio of female to male NAR) was close to 1, in rural Nigeria the difference was 5.8% and the GPI was 0.82. In the poorest households the gender gap was 5.5% but in the richest household the gap was reversed: the NAR of girls was 2.3% above the NAR of boys. To reach the Millennium Development Goal of gender parity, education policy has to target poor rural residents.

Secondary school net attendance rate, Nigeria 2003

Total
NAR (%)
Male NAR (%)Female NAR (%)Difference
male- female
GPI
female/ male
Urban46.347.245.31.90.96
Rural28.731.725.95.80.82
Richest 20%63.862.664.9-2.31.04
Poorest 20%14.617.512.05.50.69
Total35.137.532.64.90.87
GPI: gender parity index. - Data source: Nigeria 2003 DHS.

Related articles:
- Primary school attendance in Nigeria
- Age and level of education in Nigeria
- Household wealth and school attendance in Nigeria


Friedrich Huebler, 16 November 2005 (edited 21 January 2006), Creative Commons License

Monday, October 31, 2005

Primary school attendance in Nigeria

Nigeria is one of UNICEF's 25 priority countries for girls' education. In the year 2005, the population of Nigeria is estimated to be 130 million, which makes it the most populous country in Africa. 22 million children are 6 to 11 years old, the official primary school age in Nigeria.

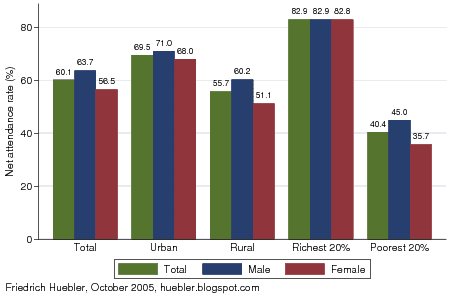
The most recent data on school attendance in Nigeria comes from a Demographic and Health Survey (DHS) that was conducted in 2003. 60.1% of all children of primary school age were attending primary school at the time of the survey. Boys had a higher net attendance rate (NAR) than girls, with 63.7% compared to 56.5% for girls.

Primary school net attendance rate, Nigeria 2003
Bar chart with total, male and female primary school net attendance rate in Nigeria, 2003
Data source: Nigeria 2003 DHS.

Children in urban areas had a higher primary NAR (69.5%) than children in rural areas (55.7%). The disparity between children from the richest and poorest households was even greater. In the richest 20% of all households, 82.9% of all children of primary school age attended primary school. In the poorest 20% of all households only two out of five children were in school (primary NAR 40.4%).

A comparison of the male and female NAR reveals that there was no gender disparity in the richest households. In urban areas, the difference between male and female NAR was also relatively small, with a gender gap of just 3.1%. In rural areas and among the poorest 20% of all households, girls were far less likely to attend school than boys; in both cases, the primary NAR of girls was about 9% below that of boys.

Primary school net attendance rate, Nigeria 2003

Total
NAR (%)
Male NAR (%)Female NAR (%)Difference
male- female
GPI
female/ male
Urban69.571.068.03.10.96
Rural55.760.251.19.00.85
Richest 20%82.982.982.80.11.00
Poorest 20%40.445.035.79.30.79
Total60.163.756.57.20.89
GPI: gender parity index. - Data source: Nigeria 2003 DHS.

Related articles:
- Secondary school attendance in Nigeria
- Age and level of education in Nigeria
- Household wealth and school attendance in Nigeria


Friedrich Huebler, 31 October 2005 (edited 21 January 2006), Creative Commons License