Tuesday, November 15, 2005

Secondary school attendance in Nigeria

Nigeria is the country with the largest population in Africa, estimated at 130 million in 2005. The most recent education data for Nigeria was collected in a Demographic and Health Survey (DHS) in 2003. 60.1% of all children of primary school age were attending primary school at the time of the survey.

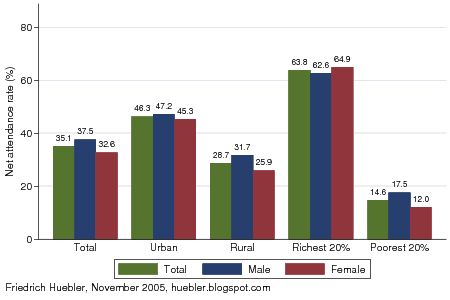
Far fewer children continue their education at the secondary level. The official secondary school age in Nigeria is 12 to 17 years and 35.1% of the children in this age group were in secondary school according to the DHS. For boys the secondary school net attendance rate (NAR) was 37.5% and for girls it was 32.6%.

Secondary school net attendance rate, Nigeria 2003
Bar chart with total, male and female secondary school net attendance rate in Nigeria, 2003
Data source: Nigeria 2003 DHS.

The attendance rate is strongly linked to household wealth and area of residence. 63.8% of children from the richest 20% of all households were in secondary school, compared to only 14.6% of children from the poorest 20% of all households. The secondary school NAR in urban areas was 46.3% and in rural areas it was 28.7%.

At the country level, the secondary school NAR of girls was 4.9% below the male NAR. This gender disparity is a result of lower attendance rates among girls in rural areas and in poor households. In urban Nigeria, the difference between male and female attendance rates was 1.9% and the gender parity index (GPI, the ratio of female to male NAR) was close to 1, in rural Nigeria the difference was 5.8% and the GPI was 0.82. In the poorest households the gender gap was 5.5% but in the richest household the gap was reversed: the NAR of girls was 2.3% above the NAR of boys. To reach the Millennium Development Goal of gender parity, education policy has to target poor rural residents.

Secondary school net attendance rate, Nigeria 2003

Total
NAR (%)
Male NAR (%)Female NAR (%)Difference
male- female
GPI
female/ male
Urban46.347.245.31.90.96
Rural28.731.725.95.80.82
Richest 20%63.862.664.9-2.31.04
Poorest 20%14.617.512.05.50.69
Total35.137.532.64.90.87
GPI: gender parity index. - Data source: Nigeria 2003 DHS.

Related articles:
- Primary school attendance in Nigeria
- Age and level of education in Nigeria
- Household wealth and school attendance in Nigeria


Friedrich Huebler, 16 November 2005 (edited 21 January 2006), Creative Commons License

Sunday, November 6, 2005

Guide to creating maps with Stata

The graphs and maps on this site are created with the Stata statistical package. This article describes how to make maps like those showing Millennium Development Goal regions and UNICEF regions in Stata from a shapefile.

Shapefiles store geographic features and related information and were developed by ESRI for its ArcGIS line of software. The shapefile format is used by many other programs and maps in this format can be downloaded from various sites on the Internet. Another common map format is the MapInfo Interchange Format for use with the MapInfo software. Shapefile data is usually stored in a set of three files (.shp, .shx, .dbf), while MapInfo data is stored in two files (.mif, .mid). Some sources for shapefiles and other data are listed on the website of the U.S. Centers for Disease Control and Prevention (CDC) under "Resources for Creating Public Health Maps." The CDC itself provides shapefiles for all countries with administrative boundaries down to the state level. Please note that these shapefiles are not in the public domain and are intended for use with the CDC's Epi Info software only. Other sources of shapefiles can be found with a Google search.

This guide is divided into two parts. Read part 1 if you have Stata 9 or 10 and part 2 if you have Stata 8. The creation of maps is not supported in older versions of Stata.


Part 1: Creating maps with Stata 9 or 10

To create a map with Stata 9 or 10 you need the following software.
  • Stata version 9.2 or newer.
  • spmap: Stata module for drawing thematic maps, by Maurizio Pisati. Install in Stata with the command "ssc install spmap".
  • shp2dta: Stata module for converting shapefiles to Stata format, by Kevin Crow. Install in Stata with the command "ssc install shp2dta".
  • Shapefile: For the example in this guide, download world_adm0.zip (646 KB), a shapefile that contains the boundaries of all countries of the world.
Step 1: Convert shapefile to Stata format
  • Unzip world_adm0.zip to a folder that is visible to Stata. The archive contains three files called world_adm0.dbf, world_adm0.shp, and world_adm0.shx.
  • Start Stata and run this command:
    shp2dta using world_adm0, data(world-d) coor(world-c) genid(id)
    Two new files will be created: world-d.dta (with the country names and other information) and world-c.dta (with the coordinates of the country boundaries). If you plan to superimpose labels on a map, for example country names, you should run the following command instead, which will add centroid coordinates to the file world-d.dta:
    shp2dta using world_adm0, data(world-d) coor(world-c) genid(id) genc(c)
    Please refer to the spmap documentation to learn more about labels because they are not covered in this guide.
  • The DBF, SHP, and SHX files can be deleted.
Some shapefiles are not compatible with the shp2dta command and Stata will abort the conversion with an error message. If this is the case, you can use a combination of two other programs, shp2mif and mif2dta. These programs are explained in the instructions for Stata 8 (see Step 1 and Step 2 in part 2 of this guide).

Step 2: Draw map in Stata
  • Open world-d.dta in Stata.
  • The file contains no country-specific data that could be used for this example so we will create a variable with the length of each country's name. The Stata command for this is:
    generate length = length(NAME)
  • Draw a map that indicates the length of all country names with this command:
    spmap length using "world-c.dta", id(id)
    Be patient because spmap is slow if a map contains many features.
  • The default map is monochrome, it shows Antarctica, the legend is too small and the legend values are arranged from high to low. We can draw a second map without Antarctica, with a blue palette, and with a bigger legend with values arranged from low to high:
    spmap length using "world-c.dta" if NAME!="Antarctica", id(id) fcolor(Blues) legend(symy(*2) symx(*2) size(*2)) legorder(lohi)
You now have the map below. Darker colors indicate longer names, ranging from 4 letters (for example Cuba and Iraq) to 33 letters (Falkland Islands (Islas Malvinas)). To customize the map further, please read the Stata help file for spmap.

Map created with spmap in Stata: length of country names
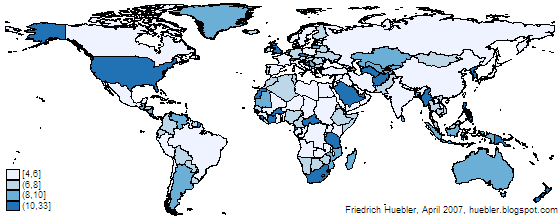
Example map created with spmap in Stata

The instructions above can be used to convert any shapefile to Stata format. If you have maps in MapInfo format you have to use another program called mif2dta that is described in part 2 of this guide.


Part 2: Creating maps with Stata 8

To create a map with Stata 8 you need the following software.
  • Stata version 8.2.
  • tmap: Stata module for thematic mapping by Maurizio Pisati. Install in Stata with the command "ssc install tmap".
  • mif2dta: Stata module for converting files from MapInfo to Stata format, also by Maurizio Pisati. Install in Stata with the command "ssc install mif2dta".
  • SHP2MIF: DOS program for converting shapefiles to MapInfo format. Go to the the website of RouteWare and click on "SHP2MIF (135 Kb)" under the heading "Converters" to get ishp2mif.zip.
  • Shapefile: For the example in this guide, download world_adm0.zip (646 KB), a shapefile that contains the boundaries of all countries of the world.
Step 1: Convert shapefile to MapInfo format
  • Unzip ishp2mif.zip. The archive contains three files, among them SHP2MIF.EXE.
  • Unzip world_adm0.zip to the same folder as SHP2MIF.EXE. The archive contains three files called world_adm0.dbf, world_adm0.shp, and world_adm0.shx.
  • Open a DOS command window: Windows Start menu - Run - "command" - OK.
  • Change the path in the command window to the folder that contains SHP2MIF.EXE and the three map files. Use the DOS command "cd" to change the path.
  • SHP2MIF works best with short file names in the 8.3 format (name up to 8 characters, extension up to 3 characters). Rename the map files with this DOS command:
    rename world_adm0.* world.*
    The map files are now called world.dbf, world.shp, and world.shx.
  • Convert the maps to MapInfo format by typing "shp2mif world" in the DOS command window. This produces two new files: WORLD.MID and WORLD.MIF.
  • Close the DOS command window.
  • The DBF, SHP and SHX files can be deleted.
Step 2: Convert MapInfo files to Stata format
  • Move the MIF and MID files to a folder that is visible to Stata.
  • Start Stata and run this command:
    mif2dta world, genid(id)
    Two new files will be created: world-Coordinates.dta (with the country boundaries) and world-Database.dta (with the country names and other information). If you plan to superimpose labels on a map, for example country names, you should run the following command instead, which will add centroid coordinates to the file world-Database.dta:
    mif2dta world, genid(id) genc(c)
    Please refer to the tmap documentation to learn more about labels because they are not covered in this guide.
  • The MIF and MID files can be deleted.
Step 3: Draw map in Stata
  • Open world-Database.dta in Stata.
  • The file contains no country-specific data that could be used for this example so we will create a variable with the length of each country's name. The Stata command for this is:
    generate length = length(name)
  • Draw a map that indicates the length of all country names with this command:
    tmap choropleth length, map(world-Coordinates.dta) id(id)
    Be patient because tmap is slow if a map contains many features.
  • The default map is monochrome, it shows Antarctica and the legend is too small. We can draw a second map without Antarctica, with a blue palette, and with a bigger legend:
    tmap choropleth length if name!="Antarctica", map(world-Coordinates.dta) id(id) palette(Blues) legsize(2)
  • To reduce the margins, display the graph again and set the margins to zero:
    graph display, margins(zero)
You now have the map below. Darker colors indicate longer names, ranging from 4 letters (for example Cuba and Iraq) to 33 letters (Falkland Islands (Islas Malvinas)). To customize the map further, please read the Stata help file for tmap and the tmap user's guide by Maurizio Pisati. The user's guide and additional tmap files can be downloaded in Stata with the commands "ssc describe tmap" and "net get tmap".

Map created with tmap in Stata: length of country names
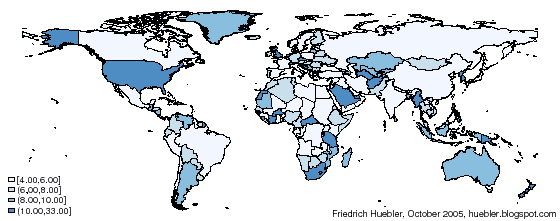
Example map created with tmap in Stata

The instructions above can be used to convert any shapefile to Stata format. If you have maps in MapInfo format you can skip step 1 of the instructions and start with step 2.


Related articles
External linksFriedrich Huebler, 6 November 2005 (edited 30 June 2009), Creative Commons License
Permanent URL: http://huebler.blogspot.com/2005/11/creating-maps-with-stata.html
Monday, October 31, 2005

Primary school attendance in Nigeria

Nigeria is one of UNICEF's 25 priority countries for girls' education. In the year 2005, the population of Nigeria is estimated to be 130 million, which makes it the most populous country in Africa. 22 million children are 6 to 11 years old, the official primary school age in Nigeria.

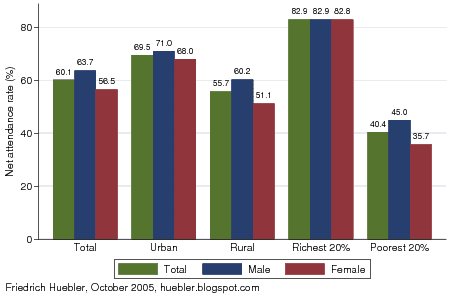
The most recent data on school attendance in Nigeria comes from a Demographic and Health Survey (DHS) that was conducted in 2003. 60.1% of all children of primary school age were attending primary school at the time of the survey. Boys had a higher net attendance rate (NAR) than girls, with 63.7% compared to 56.5% for girls.

Primary school net attendance rate, Nigeria 2003
Bar chart with total, male and female primary school net attendance rate in Nigeria, 2003
Data source: Nigeria 2003 DHS.

Children in urban areas had a higher primary NAR (69.5%) than children in rural areas (55.7%). The disparity between children from the richest and poorest households was even greater. In the richest 20% of all households, 82.9% of all children of primary school age attended primary school. In the poorest 20% of all households only two out of five children were in school (primary NAR 40.4%).

A comparison of the male and female NAR reveals that there was no gender disparity in the richest households. In urban areas, the difference between male and female NAR was also relatively small, with a gender gap of just 3.1%. In rural areas and among the poorest 20% of all households, girls were far less likely to attend school than boys; in both cases, the primary NAR of girls was about 9% below that of boys.

Primary school net attendance rate, Nigeria 2003

Total
NAR (%)
Male NAR (%)Female NAR (%)Difference
male- female
GPI
female/ male
Urban69.571.068.03.10.96
Rural55.760.251.19.00.85
Richest 20%82.982.982.80.11.00
Poorest 20%40.445.035.79.30.79
Total60.163.756.57.20.89
GPI: gender parity index. - Data source: Nigeria 2003 DHS.

Related articles:
- Secondary school attendance in Nigeria
- Age and level of education in Nigeria
- Household wealth and school attendance in Nigeria


Friedrich Huebler, 31 October 2005 (edited 21 January 2006), Creative Commons License

Monday, October 24, 2005

UNICEF priority countries for girls' education

Two of the UN Millennium Development Goals address education:
  • Goal 2: Achieve universal primary education
  • Goal 3: Promote gender equality and empower women
Goal 3 states further that gender disparity in primary and secondary education was to be eliminated preferably by 2005 and at all levels of education no later than 2015. Data on school attendance in 2005 is not yet available but recent estimates make clear that a large gender gap continues to exist in many countries, especially in South Asia and Sub-Saharan Africa.

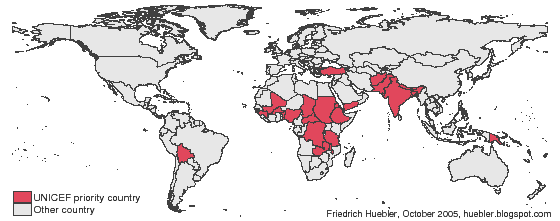
UNICEF has identified 25 priority countries to reduce the number of girls currently out of school. The 25 countries are Afghanistan, Bangladesh, Benin, Bhutan, Bolivia, Burkina Faso, Central African Republic, Chad, Democratic Republic of Congo, Djibouti, Eritrea, Ethiopia, Guinea, India, Malawi, Mali, Nepal, Nigeria, Pakistan, Papua New Guinea, Sudan, Tanzania, Turkey, Yemen and Zambia.

UNICEF priority countries for girls' education
Map that highlights the 25 priority countries of UNICEF for progress in girls' education

The countries, highlighted in the map above, were selected if they met the following criteria:
  • female primary school net enrollment rate below 70%,
  • gender gap in primary education above 10%,
  • more than 1 million girls out of school,
  • included in the Education for All Fast Track Initiative of the World Bank,
  • affected by crises like HIV/AIDS and military conflict.
During the past weeks I presented data on primary school attendance, secondary school attendance, educational attainment and primary school completion in India, the largest of the 25 countries listed above. Over the coming weeks I will assess the progress of other countries toward the Millennium Development Goals.

Friedrich Huebler, 24 October 2005, Creative Commons License

Tuesday, October 18, 2005

Primary school completion in India, 1950-2000

The share of the Indian population who attended school has increased steadily over the past 50 years. Data on educational attainment in India shows that about 80% of all persons born around 1990 have attended at least primary school. Of the generation born between 1950 and 1970, only about 55% ever attended school.

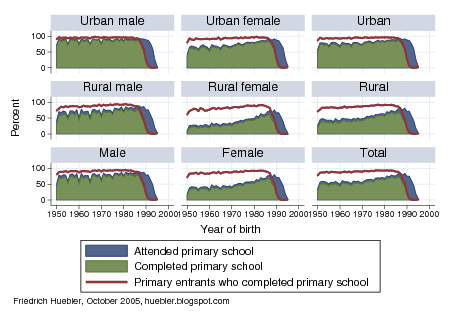
Not every child who enters primary school completes that level of education. High dropout rates are a particular concern in Sub-Saharan Africa, the region with the lowest school life expectancy values worldwide. In India, on the other hand, most children who enter the first grade stay in primary school until they graduate after five years of education. The graph below compares the percentage of Indians who attended primary school (independent of the number of years) with the percentage who completed primary education between 1950 and 2000. The data, from a 2000 Multiple Indicator Cluster Survey (MICS), is disaggegrated by sex and area of residence.

Primary school attendance and completion by year of birth, India 1950-2000
Chart with share of population who attended and completed primary education by year of birth, India 1950-2000
Data source: India 2000 MICS.

The population is grouped by year of birth and for each cohort three values are shown:
  • the percentage who attended primary school or higher (blue area)
  • the percentage who completed primary school (green area)
  • the percentage of primary entrants who completed primary school (ratio completed primary/attended primary, red line)
In urban areas, virtually all residents who attend primary school also complete that level of education. In rural India, completion rates are slightly lower but even here children typically stay in school until they graduate. 85% to 90% of primary school students born between 1950 and 1970 went on to graduate. Since 1970, this share has increased to more than 93% for India as a whole and in urban areas this value is as high as 97%. (The gap between primary school attendance and completion rates since 1990 is explained by the fact that children born since then were not old enough to have completed primary school at the time of the survey.)

The education system in India succeeds at keeping children in school. Children currently out of school are therefore likely to complete at least the primary level of education once they take the crucial step of enrolling in the first grade. A disaggregation of primary school attendance rates in India makes clear that many of the children out of school are girls from poor rural households. Educators and policy makers have to focus their efforts on this group of children to reach the Millennium Development Goal of universal primary education.

Related articles
Friedrich Huebler, 18 October 2005 (edited 12 October 2008), Creative Commons License
Permanent URL: http://huebler.blogspot.com/2005/10/primary-school-completion-in-india.html

Sunday, October 9, 2005

Educational attainment in India, 1950-2000

India is well on the way to achieving the Millennium Development Goal of universal primary education by the year 2015. In spite of rapid population growth during the last 50 years, India has managed to expand its education system to reach an ever larger part of the population.

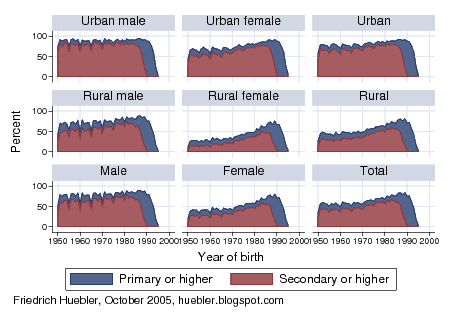
The increase in educational attainment since 1950 can be traced with data from a Multiple Indicator Cluster Survey (MICS) that was conducted in India in 2000. This nationally representative household survey collected data on the education of all household members aged 5 years or older. The data indicates whether a person attended school, at which level, and for how many years. By grouping all household members by year of birth we can calculate the percentage of a cohort that has attended - but not necessarily completed - a certain level of education. The graph below plots these values for all persons born between 1950 and 2000, disaggregated by sex and area of residence.

Educational attainment by year of birth, India 1950-2000
Chart with educational attainment (primary, secondary or higher) by year of birth, India 1950-2000
Data source: India 2000 MICS.

For each cohort two values are shown:
  • the percentage who attended primary school or higher (blue area)
  • the percentage who attended secondary school or higher (red area)
Until the 1970s, attendance rates for the population as a whole remained stable. About 55% of the population born between 1950 and 1970 attended primary school or higher. For persons born around 1990, this value has increased to roughly 80%.

School attendance rates were historically highest among urban males. Already in the 1950s, 90% of this group attended school at the primary level or higher. In contrast, the most disadvantaged group are women living in rural India. In the 1950s, only 25% of this group attended at least primary school. Women born since the 1970s are much more likely to benefit from education. The percentage of rural women who attended primary school or higher has increased from about 30% in the 1960s to about 70% in the 1990s.

Secondary school attendance rates have increased at a similar pace but at a lower lever. Most children who attend primary school continue their education at the secondary level. In 2000, the primary school net attendance rate in India overall was estimated to be 75% for boys and 69% for girls. The secondary school net attendance rate was estimated to be 54% for boys and 46% for girls. There has been much progress toward gender equality over the last 50 years but women and girls are still disadvantaged in Indian society.

Related articles
Friedrich Huebler, 10 October 2005 (edited 12 October 2008), Creative Commons License
Permanent URL: http://huebler.blogspot.com/2005/10/educational-attainment-in-india-1950.html

Sunday, October 2, 2005

Guide to reading Statalist with Gmail

Statalist is a mailing list for users of the Stata statistical package. To subscribe to Statalist, send an e-mail message to majordomo@hsphsun2.harvard.edu, with the text "subscribe statalist" (without quotes) in the body of the message.

In Gmail all messages are displayed with a variable-width font by default. This can make Statalist messages hard to read if they contain tables that only lign up properly with a fixed-width font. Here is a typical Stata table:
    Variable |       Obs        Mean    Std. Dev.       Min        Max
-------------+--------------------------------------------------------
age | 11258 10.46394 2.277534 7 14
school | 11209 .7712552 .4200433 0 1
In Gmail the same table would be displayed like this:

    Variable |       Obs        Mean    Std. Dev.       Min        Max
-------------+--------------------------------------------------------
         age |     11258    10.46394    2.277534          7         14
      school |     11209    .7712552    .4200433          0          1

Gmail has no setting to change the font but users of the Firefox browser can overcome this limitation by editing the file userContent.css in their Firefox profile. If the file userContent.css does not exist you can create a text file with that name and save it in your profile folder. This and other profile files can also be edited easily with the chromEdit extension for Firefox.

Adding the lines below to userContent.css overrides the Gmail settings for non-HTML mail and all simple text messages are then displayed with a fixed-width font.
div.msg div.mb {
font-family: monospace !important;
font-size: 12px !important;
}
textarea.tb {
font-family: monospace !important;
font-size: 12px !important;
}
td.ct {
font-family: monospace !important;
font-size: 12px !important;
}
The procedure is described in more detail on the site of Michael Gauthier, where I learned about this approach.

Update (22 June 2008)

As of June 2008, the instructions above are obsolete. Google has added a "Fixed width font" option to Gmail. To activate this feature, follow these steps:
  • In Gmail, click on "Settings".
  • In the Settings menu, click on "Labs".
  • Look for the "Fixed width font" option and select "Enable".
  • Click on "Save Changes".
To read a message in fixed width font, open the message, click on the "Reply" drop-down menu in the upper right corner of the message, and select "Show in fixed width font".

Related articles
Friedrich Huebler, 3 October 2005 (edited 22 June 2008), Creative Commons License