Education statistics published by the
UNESCO Institute for Statistics rely on two sources of data: (a) administrative records of enrollment that are provided by national governments and (b) population statistics from the
United Nations Population Division. For example, the primary school net enrollment rate is calculated as follows:
- Primary school NER = children of primary school age enrolled in primary school / total population of primary school age
The numerator uses national enrollment data and the denominator population data from the UN Population Division. This combination of data from two different sources can lead to errors in the calculation of indicators like the NER. Estimates by the UN Population Division may not match the actual population figures in a country. Local schools, whose records are aggregated at the national level, may misstate enrollment to obtain financing and governments may do the same to meet objectives like the
Millennium Development Goals. A further limitation of education statistics based on administrative records is that they provide little information about the characteristics of students beyond age and sex. In spite of these concerns, the data published by UNESCO remains the most comprehensive collection of global education statistics.
Household surveys are an alternative source of data on education. Because survey data is collected at the household level, it is possible to capture a large amount of additional information on children and the households and communities they live in. In contrast to records of enrollment, household surveys also provide data on children out of school that can be analyzed to guide policies aimed at increasing school enrollment rates.
Estimates derived from surveys use a single source of data, which minimizes problems that arise from the combination of data from different sources. However, the estimates are affected by two other types of errors: sampling errors and nonsampling errors. Sampling errors arise because surveys cover only a part of the population and estimates are therefore not identical to those that would be obtained by surveying the entire population of a country. Nonsampling errors are the result of mistakes during data collection and data processing, for example incorrect responses by survey respondents and mistakes during data entry. Sampling errors can be minimized by selecting a sufficiently large sample and nonsampling errors can be minimized through training of survey staff.
Two household survey programs that focus on developing countries are the
Demographic and Health Surveys (DHS) and the
Multiple Indicator Cluster Surveys (MICS). The DHS were initiated by the U.S. Agency for International Development (USAID) in the 1980s to provide data on population and health trends. The MICS program was developed by UNICEF in the 1990s to monitor the situation of women and children.
Both the DHS and the MICS collect data on school attendance. As an example I show estimates for the primary school net attendance rate (NAR) from the 2000 MICS in India. The primary school NAR is calculated as follows:
- Primary school NAR = number of children of primary school age that are attending primary school / number of children of primary school age
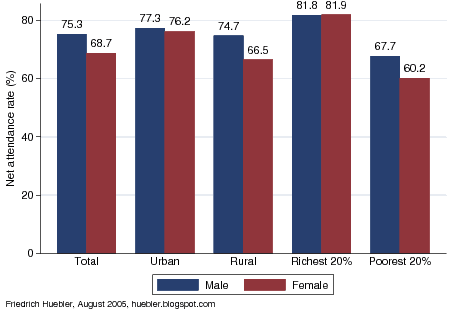
Similar to the NER, the maximum value of the NAR is 100%. In the India MICS, 72.1% of all children of primary school age (6-10 years) were found to be in primary school. Attendance rates were higher among boys than girls (75.3% vs. 68.7%). NER data from UNESCO limits the analysis to a breakdown by sex but with survey data we can also analyze other disparities. In India, for example, urban children (NAR 76.8%) are more likely to attend primary school than rural children (NAR 70.7%). Household wealth is also an important determinant of school attendance. Among the poorest 20% of all households, only 64.0% of children attend primary school, compared to 81.9% of children from the richest 20% of all households.
Primary school net attendance rate, India 2000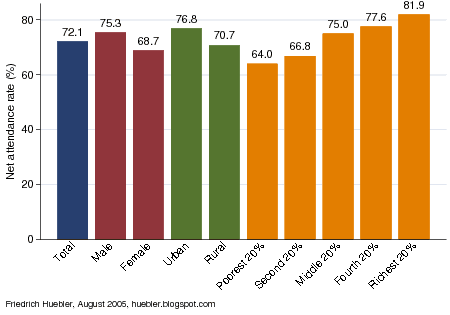 Data source: India 2000 MICS.
In the coming weeks I will present more education data from household surveys. By providing detailed information on the determinants of school attendance at the household level, surveys are an important tool for policy makers and for researchers and organizations that work in the area of education.
Related articlesFriedrich Huebler, 22 August 2005 (edited 12 October 2008), Creative Commons License
Permanent URL: http://huebler.blogspot.com/2005/08/education-data-from-household-surveys.html.