Sunday, July 29, 2007

UN Millennium Development Goals Report 2007

Cover of UN MDG Report 2007In June 2007, the United Nations published the latest edition of its annual report on progress toward the Millennium Development Goals (MDG). The Millennium Development Goals Report 2007 presents data for each of the eight MDGs.
  1. Eradicate extreme poverty and hunger
  2. Achieve universal primary education
  3. Promote gender equality and empower women
  4. Reduce child mortality
  5. Improve maternal health
  6. Combat HIV/AIDS, malaria and other diseases
  7. Ensure environmental sustainability
  8. Develop a global partnership for development
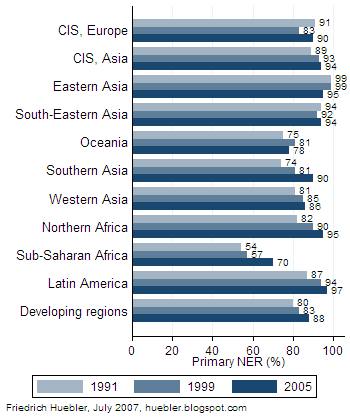
In the section on MDG 2, the achievement of universal primary education, the report shows trends in primary school enrollment from 1991 to 2005. The statistics are presented by MDG region. One region, the Commonwealth of Independent States, is further divided into countries in Europe and Asia.

Primary school net enrollment rate, 1991-2005
Bar graph with regional primary school net enrollment rates from 1991 to 2005
Source: United Nations, The Millennium Development Goals Report 2007, page 10.

Seven regions have reached primary school net enrollment rates at or above 90 percent: Commonwealth of Independent States (Europe and Asia), Eastern Asia, South-Eastern Asia, Southern Asia, Western Asia, Northern Africa, and Latin America. Western Asia is slightly behind with a primary NER of 86 percent, followed by Oceania at 78 percent.

Sub-Saharan Africa has made the most progress over the past years, with a 13 percent increase in the primary NER from 57 percent in 1999 to 70 percent in 2005. Still, three out of ten children of primary school age in Sub-Saharan Africa are not enrolled in primary school. In all developing regions combined, the primary NER rose from 80 percent in 1991 to 88 percent in 2005.

Related articles
External links
Friedrich Huebler, 29 July 2007 (edited 17 October 2008), Creative Commons License
Permanent URL: http://huebler.blogspot.com/2007/07/un-millennium-development-goals-report.html

Sunday, July 22, 2007

Disparity between adult and youth literacy

Two recent articles on this web site present the latest data from the UNESCO Institute for Statistics (UIS) on adult literacy and youth literacy worldwide. The adult literacy rate refers to the population aged 15 years and over, the youth literacy rate to the population aged 15 to 24 years. Youth literacy is generally higher than adult literacy, due to increasing levels of school attendance over the past decades.

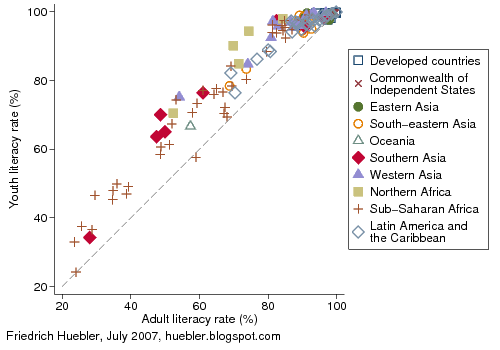
The scatter plot in Figure 1 compares adult and youth literacy in 133 countries with data. The adult literacy rate is plotted along the horizontal axis and the youth literacy rate along the vertical axis. Almost all countries are located above the 45 degree line in the graph, which means that youth literacy is higher than adult literacy. Countries with no difference between the two literacy rates are located along the 45 degree line.

Figure 1: Adult and youth literacy: all countries with data
Scatter plot of adult and youth literacy rates by country
Source: UNESCO Institute for Statistics, Data Centre, June 2007.

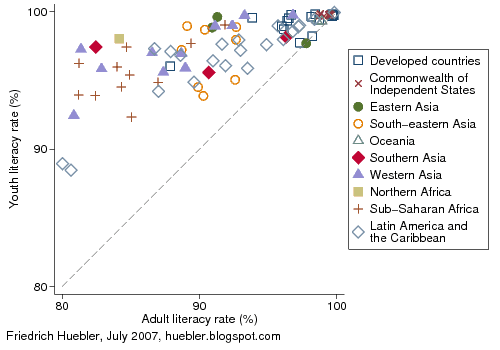
Many countries are located close together in the upper right corner of Figure 1. To show the distribution in that part of the graph more clearly, Figure 2 plots only the 87 countries with literacy rates above 80 percent. Because of the scale, the difference between adult and youth literacy is exaggerated compared to Figure 1. The shape and color of the markers in both graphs indicate the Millennium Development Goal (MDG) region in which each country is located. The lowest literacy rates, below 60 percent, are reported for countries in Sub-Saharan Africa and Southern Asia.

As Figure 2 shows, some countries from Sub-Saharan Africa and Southern Asia have highly literate populations, with literacy rates above 80 or 90 percent. Other countries with high literacy rates are located in Latin America and the Caribbean, Western Asia, South-eastern Asia, and the other MDG regions. Developed countries and countries from the Commonwealth of Independent States are clustered in the upper right corner of Figure 2, near 100 percent adult and youth literacy.

Figure 2: Adult and youth literacy: countries with literacy rates above 80 percent
Scatter plot of adult and youth literacy rates by country
Source: UNESCO Institute for Statistics, Data Centre, June 2007.

The average literacy rates in each MDG region are listed in Table 1. The mean literacy rates are simple unweighted averages across the countries with literacy data in a region and the values are therefore not representative for the entire population in each region.

Table 1 confirms the impression from Figure 1: adult and youth literacy rates are lowest in Sub-Saharan Africa and Southern Asia. In both regions, less than two thirds of the adult population are literate and the youth literacy rate is 10 to 12 percent higher than the adult literacy rate. In Western Asia, the youth literacy rate is also 10 percent above the adult literacy rate, but with an adult literacy rate of 85 percent, many more people can read and write than in Sub-Saharan Africa and Southern Asia.

The difference between the two literacy rates is greatest in Northern Africa, where 88 percent of the population aged 15 to 24 years are literate, compared to 70 percent of the population aged 15 years or more. Based on the available data, smaller gaps between adult and youth literacy exist in Eastern Asia, South-eastern Asia, Oceania, and Latin America and the Caribbean. In the developed countries and in the countries of the Commonwealth of Independent States, nearly the entire adult population is literate.

Table 1: Adult and youth literacy by MDG region
MDG regionCountries
with data in region
Adult literacy
rate (%)
Youth literacy
rate (%)
Difference youth-adult
literacy rate (%)
Developed countries1697.199.12.1
Commonwealth of Independent States1099.299.80.6
Eastern Asia393.398.75.4
South-eastern Asia1086.993.76.8
Oceania482.288.43.5
Southern Asia863.175.112.0
Western Asia1485.194.89.8
Northern Africa570.487.617.2
Sub-Saharan Africa4261.571.110.3
Latin America and the Caribbean2589.194.85.3
World13779.487.07.5
Source: UNESCO Institute for Statistics, Data Centre, June 2007. Regional averages are unweighted. 137 countries have data on adult literacy, 133 countries have data on youth literacy.

Please visit the UIS Data Centre to download complete tables with national data on adult and youth literacy.

Related articles
External links
Friedrich Huebler, 22 July 2007 (edited 17 October 2008), Creative Commons License
Permanent URL: http://huebler.blogspot.com/2007/07/disparity-between-adult-and-youth.html

Sunday, July 15, 2007

Youth literacy rates

Last week, I posted an article on adult literacy with the latest statistics from the UNESCO Institute for Statistics (UIS). Today's article will look at the latest statistics on youth literacy. The youth literacy rate is the share of the population aged 15 to 24 years that is literate.

UNESCO provides national data on youth literacy for 133 countries. This compares to 137 countries for which the adult literacy rate is known. The youth literacy rate is usually higher than the adult literacy rate, especially in developing countries where the education system has expanded over the past decades. In a country where school attendance rates increase over time, persons born in a later year are more likely to attend school and to become literate.

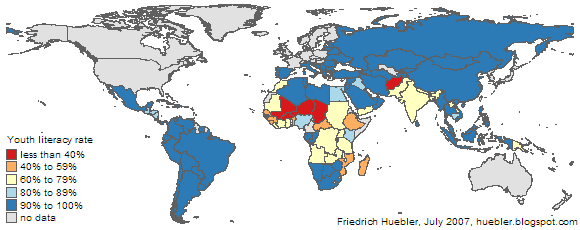
The map below displays the youth literacy rate for each country with data, ranging from 24.2 percent in Mali to 100 percent in Cuba. Most industrialized countries have no data on youth literacy, but school attendance is almost universal in these countries and literacy rates are therefore also high.

Youth literacy rates by country
World map with youth literacy rate by country
Source: UNESCO Institute for Statistics, Data Centre, June 2007.

In Eastern Europe, East and Southeast Asia, and Latin America, youth literacy rates are generally 90 percent or higher. In some countries in Africa and the Middle East, youth literacy rates are also at or above 90 percent. Of 133 countries with data, 87 report youth literacy rates between 90 and 100 percent. 10 more countries have literacy rates between 80 and 90 percent.

In 5 countries, less than 40 percent of the population between 15 and 24 years are literate: Mali (youth literacy rate 24.2 percent), Burkina Faso (33.0), Afghanistan (34.3), Niger (36.5), and Chad (37.6). In 8 countries, the youth literacy rate is between 40 and 60 percent: Benin (45.3), Guinea (46.6), Mozambique (47.0), Sierra Leone (47.9), Senegal (49.1), Ethiopia (49.9), Madagascar (57.6), and the Central African Republic (58.5). In the remaining 23 countries, the youth literacy is between 60 and 80 percent.

The complete set of youth and adult literacy statistics is available at the UIS Data Centre.

Related articles
External links
Friedrich Huebler, 15 July 2007 (edited 22 July 2007), Creative Commons License
Permanent link: http://huebler.blogspot.com/2007/07/youth-literacy-rates.html

Sunday, July 8, 2007

Adult literacy rates

In June 2007, the UNESCO Institute for Statistics (UIS) released its latest literacy statistics, covering the years 1985 to 2005. In a change from literacy statistics released in previous years, UIS only reports on observed literacy and no longer uses proxy variables like educational attainment. The UIS database contains two sets of literacy rates:
  • Youth literacy rate: the share of the population aged 15 to 24 years that is literate.
  • Adult literacy rate: the share of the population aged 15 years and older that is literate.
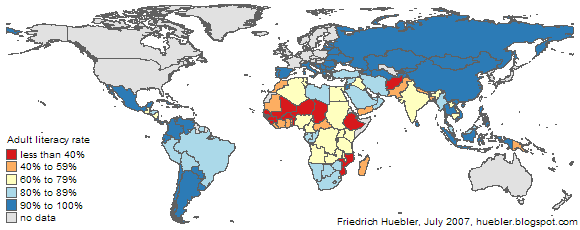
Both literacy rates are reported at the national and regional level. The adult literacy rate is available for 137 countries, shown in the map below. It ranges from 23.6 percent in Burkina Faso to 99.8 percent in Cuba. For 71 countries, the adult literacy rate is unknown but most of these countries are industrialized and literacy can therefore be assumed to be at a high level.

Adult literacy rates by country
World map with adult literacy rate by country
Source: UNESCO Institute for Statistics, Data Centre, June 2007.

Among countries with data, the highest literacy rates are observed in Eastern Europe, East and Southeast Asia, and Latin America. Virtually all countries in these regions have literacy rates above 80 percent. Some countries in Africa also report adult literacy rates at such a high level. In 57 countries worldwide, more than 90 percent of the adult population are literate. 31 countries have literacy rates between 80 and 90 percent.

The lowest literacy rates are observed in Africa and South Asia. In 6 countries, fewer than 3 out of 10 adults are literate: Burkina Faso (adult literacy rate 23.6 percent), Mali (24.0), Chad (24.7), Afghanistan (28.0), Niger (28.7), and Guinea (29.5). In 10 countries, the adult literacy rate is between 30 and 50 percent: Benin (34.7), Sierra Leone (34.8), Ethiopia (35.9), Mozambique (38.7), Senegal (39.3), Bangladesh (47.5), Central African Republic (48.6), Nepal (48.6), Cote d'Ivoire (48.7), and Pakistan (49.9).

In India, the second most populous country in the world, only 6 out of 10 adults are literate (literacy rate 61.0 percent). In China, the country with the largest population, many more people can read and write, with an adult literacy rate of 90.9 percent.

The complete set of literacy statistics is available at the UIS Data Centre.

Related articles
External links
Friedrich Huebler, 8 July 2007 (edited 22 July 2007), Creative Commons License
Permanent link: http://huebler.blogspot.com/2007/07/adult-literacy-rates.html

Saturday, June 30, 2007

UNESCO releases data from 2006 education survey

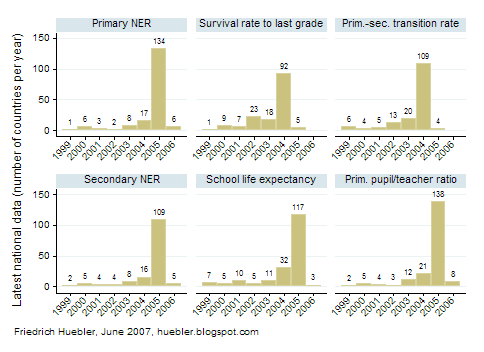
The UNESCO Institute for Statistics (UIS) has released the data from its 2006 survey of international education indicators. The database, available free of charge at the UIS Data Centre, contains annual data for 206 countries and territories from the years 1999 to 2006. For most countries, the latest available data is from the year 2005. The chart below presents the distribution of the latest national data for six indicators that are closely linked to the Millennium Development Goals on education.

Distribution of latest national data from UIS 2006 education survey
Histogram showing annual distribution of latest education data from UIS 2006 survey
Source: UNESCO Institute for Statistics, Data Centre, June 2007, stats.uis.unesco.org.

The primary school net enrollment rate is available for 177 countries. In 134 countries, the latest data is from 2005 and in 6 countries, the primary NER for 2006 is provided. For two indicators - the survival rate to the last grade of primary school and the transition rate from primary to secondary school - the latest available data for most countries is from 2004. To calculate these two indicators, data from two consecutive years is needed. As an example, to calculate the transition rate from primary to secondary school in the year 2005, data from 2005 and 2006 is required. For this reason, the most recent data lags most other indicators by one year.

The secondary school net enrollment rate is only known for 153 of 206 countries and territories, and in 109 countries the latest data is from 2005. The school life expectancy from primary to tertiary school is provided for 190 countries, and the pupil/teacher ratio in primary school for 193 countries. As with most other indicators, the latest available data is from the year 2005 for the majority of countries.

The release of the data from the 2006 education survey follows the launch of the new UIS Data Centre in June 2007. This online database provides access to pre-defined statistical tables and to customizable tables with a choice of countries, regions and indicators. The UIS Data Centre contains data for more than 1000 types of indicators in the areas of education, science and technology, culture and communication.

Related articles
External links
Friedrich Huebler, 30 June 2007 (edited 15 July 2007), Creative Commons License
Permanent link: http://huebler.blogspot.com/2007/06/unesco-releases-data-from-2006.html

Monday, May 28, 2007

Caste, ethnicity, and school attendance in Nepal

The education system in Nepal is characterized by large disparities in primary and secondary school attendance. School attendance rates are higher among boys, residents of urban areas, and children from wealthier households. These disparities are described in the article Primary and secondary school attendance in Nepal.

In Nepal, disparities are also closely linked to the Hindu caste system that divides the population into dozens of hereditary groups. At the top of the social order are members of the Brahman class of priests and scholars, followed by the Kshatriya (rulers and warriors), the Vaishya (merchants), and the Sudra (peasants and manual laborers). The lowest position in the social order is occupied by the Dalits, also referred to as "untouchables." For example, Dalits may not enter temples or fetch water from wells that are also used by members of higher castes. Although caste-based discrimination was outlawed in Nepal in 1963 it is still present in Nepali society.

Social exclusion based on caste is interlinked with exclusion based on ethnicity and religion. Members of the indigenous population of Nepal, called Janajatis, were historically ranked between the highest and lowest castes. Muslims were discriminated by virtue of belonging to a religious minority in a Hindu state and ranked above Dalits but below other groups.

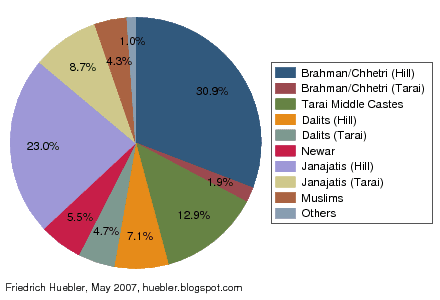
The 2001 census in Nepal identified 103 social groups based on caste, ethnicity, religion, and language. Caste groups accounted for 57.5 percent of the population, Janajatis for 37.2 percent, religious minorities for 4.3 percent, and other groups for the remaining 1 percent. This large number of social groups makes it difficult to analyze patterns of exclusion. To simplify such an analysis, a recent multi-year Gender and Social Exclusion Assesssment (GSEA) by the British Department for International Development (DFID) and the World Bank, in collaboration with the National Planning Commission of Nepal, combined the 103 social groups in 10 major categories. The results of the GSEA were published in 2006 in the report Unequal citizens: Gender, caste and ethnic exclusion in Nepal. Table 1 provides an overview of the simplified caste and ethnic groups from the GSEA.

Table 1: Caste and ethnic groups in Nepal
Share of populationSimplified group2001 census group
Hindu caste groups (57.5%)1. Brahmans and Chhetris (Hill)Brahman, Chhetri, Thakuri, Sanyasi
2. Brahmans and Chhetris (Tarai)Kayashta, Rajput, Baniya, Marwadi, Jaine, Nurang, Bengali
3. Tarai Middle CastesYadev,Teli, Kalwar, Sudi, Sonar, Lohar, Koiri, Kurmi, Kanu, Haluwai, Hajam/Thakur, Badhe, Rajbhar, Kewat Mallah, Numhar, Kahar, Lodha, Bing/Banda, Bhediyar, Mali, Kamar Dhunia
4. Dalits (Hill)Kami, Damai, Sarki, Gaine, Badi
5. Dalits (Tarai)Chamar, Musahar, Tatma, Bantar, Dhusadadh/Paswan, Khatway, Dom, Chidimar, Dhobi, Halkhor, Unidentified Dalit
Janajatis (37.2%)6. NewarAll Newari Castes
7. Janajatis (Hill)Magar,Tamang, Rai, Gurung, Limbu, Sherpa, Bhote, Walung, Buansi, Hyolmo, Gharti/Bhujel, Kumal, Sunuwar, Baramu, Pahari, Adivasi Janajati, Yakkha, Shantal, Jirel, Darai, Dura, Majhi, Dunuwar, Thami, Lepcha, Chepang, Bote, Raji, Hayu,Raute, Kasunda
8. Janajatis (Tarai)Tharu, Dhanuk, Rajbanshi, Tajpuriya, Gangai, Dhimal, Meche, Kisan, Munda, Santhal/Satar/Dhangad/Jhangad, Koche, Pattarkatta/Kusbadiya
Muslims (4.3%)9. MuslimsMuslim, Churoute
Others (1%)10. Others
Source: World Bank, and Department For International Development (DFID). 2006. Unequal citizens: Gender, caste and ethnic exclusion in Nepal - Summary. Kathmandu: World Bank, Department For International Development. Table 1, page 17.

Three groups - Brahmans and Chhetris, Dalits, and Janajatis - are further divided by geographic region. About 49 percent of the population of Nepal live in the southern tarai or terai region, the most fertile area of Nepal. 44 percent of the population live in the central hill zone that includes the capital Kathmandu. The mountain region of northern Nepal is home to only 7 percent of the population.

The composition of the population of Nepal by simplified caste and ethnic group, according to the 2001 census, is shown in Figure 1. Hill Brahman and Chhetri account for 30.9 percent of the population. The second largest group are Hill Janajatis, with 23.0 percent of the population. 12.9 percent of the population are in Tarai Middle Castes. Each of the remaining seven caste and ethnic groups account for less than 10 percent of the population.

Figure 1: Distribution of caste and ethnic groups in Nepal
Pie graph showing caste and ethnic distribution in Nepal
Source: World Bank, and Department For International Development (DFID). 2006. Unequal citizens: Gender, caste and ethnic exclusion in Nepal - Summary. Kathmandu: World Bank, Department For International Development. Figure 6, page 18.

The simplified caste and ethnic groups created by the Nepal Gender and Social Exclusion Assessment can be used to reveal disparities in the education system that go beyond characteristics like gender and household wealth (see the article Primary and secondary school attendance in Nepal on this site).

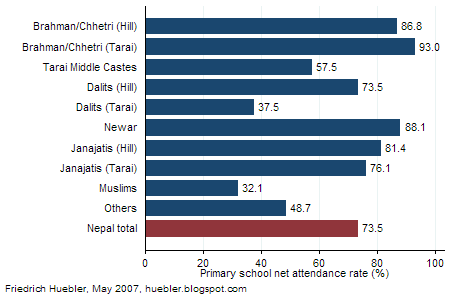
Figure 2 shows the primary school net attendance rate (NAR) - the share of children of primary school age who attend primary school - by caste or ethnicity of the household head. The data on school attendance is from a 2001 Demographic and Health Survey, a nationally representative household survey.

At the level of the country as a whole, the primary school NAR is 73.5 percent. Children from Brahman, Chhetri, and Newar households have the highest NAR values, between 86.8 and 93 percent. The lowest primary school net attendance rates are observed among Muslims (32.1 percent) and Tarai Dalits (37.5 percent). Hill Dalits (primary NAR 73.5 percent) are much more likely to attend school than Tarai Dalits. This difference in school participation can be explained by the fact that Dalits from the hill zone of Nepal are more integrated into society and therefore less subject to discrimination than Dalits from the southern tarai.

Figure 2: Primary school attendance in Nepal by caste or ethnic group of household head
Bar graph showing primary school net attendance rate in Nepal by caste or ethnicity
Source: Nepal 2001 Demographic and Health Survey (DHS).

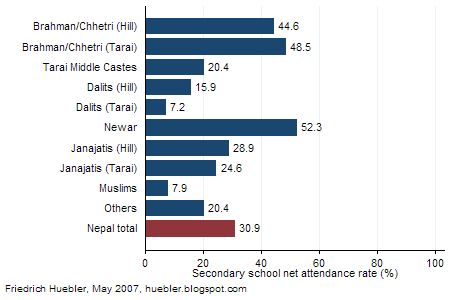
Secondary school net attendance rates in Nepal are shown in Figure 3. Overall, 30.9 percent of all Nepali children of secondary school age attend secondary school. The pattern of disparity is similar to that at the primary level of the education system. NAR values are highest among children from Newar, Brahman, and Chhetri households, ranging from 44.6 to 52.3 percent. Tarai Dalits (secondary NAR 7.2 percent) and Muslims (7.9 percent) are least likely to attend secondary school. Similar to the primary level, Hill Dalits have a net attendance rate that is twice as high as that of Tarai Dalits.

Figure 3: Secondary school attendance in Nepal by caste or ethnic group of household head
Bar graph showing secondary school net attendance rate in Nepal by caste or ethnicity
Source: Nepal 2001 Demographic and Health Survey (DHS).

In a diverse society like Nepal, an analysis of school attendance by caste and ethnicity helps policy makers identify groups that are lagging behind other parts of the population. To build an equitable and inclusive society, and to reach the Millennium Development Goal of universal primary education, it is necessary to design policies that aid Muslims, Tarai Dalits, and other disadvantaged groups in Nepal.

References
  • Geiser, Alexandra. 2005. Social exclusion and conflict transformation in Nepal: Women, dalit and ethnic groups. Bern: Swiss Peace Foundation. (Download PDF, 745 KB)
  • World Bank, and Department For International Development (DFID). 2006. Unequal citizens: Gender, caste and ethnic exclusion in Nepal - Summary. Kathmandu: World Bank, Department For International Development. (Download PDF, 14.5 MB)
Related articles
External links
Friedrich Huebler, 28 May 2007 (edited 1 March 2009), Creative Commons License
Permanent URL: http://huebler.blogspot.com/2007/05/caste-ethnicity-and-school-attendance.html
Monday, April 30, 2007

Primary and secondary school attendance in Nepal

Nepal is a country with historically large gender disparities in school attendance, where girls were much less likely than boys to receive a formal education. Since the 1980s the country has made remarkable progress toward gender parity in the education system so that the Millennium Development Goal of gender parity in primary and secondary education appears to be within reach. The trends in primary school attendance are discussed in detail in the article "Nepal: trends in primary education, 1980-2004" that was posted on this site in March 2007.

The present article takes a closer look at primary and secondary school attendance rates in Nepal. The data was collected in a Demographic and Health Survey (DHS) in 2001. DHS surveys are nationally representative household surveys that are carried out with support from the U.S. Agency for International Development. With the DHS data it is possible to examine disparities in the education system that go beyond gender.

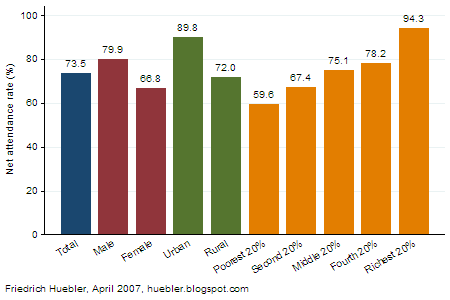
In Nepal, the official primary school age is 5 to 9 years. The official secondary school age is 10 to 16 years. The primary school net attendance rate (NAR) in 2001 is shown in Figure 1 and the secondary school NAR in Figure 2.

Overall, 73.5 percent of all children of primary school age were attending primary school. In spite of the progress toward gender parity over the past two decades, girls still attend primary school to a lesser degree than boys. The primary NAR of girls is 66.8 percent, compared to 79.9 percent for boys. However, other disparities in school attendance are larger than the male-female disparity. In rural areas, 72.0 percent of children of primary school age are in school, compared to 89.8 percent in urban areas. The biggest disparities are linked to household wealth. In the richest 20 percent of all household in Nepal, the primary NAR is 94.3 percent. As household wealth declines, the primary NAR also falls and among children from the poorest 20 percent of all households, the primary NAR is only 59.6 percent.

Figure 1: Primary school attendance in Nepal
Bar graph showing primary school net attendance rate in Nepal
Source: Nepal 2001 Demographic and Health Survey (DHS).

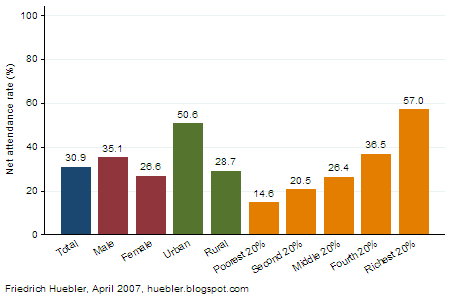
Less than half of all Nepali children continue their education at the secondary level. In the country as a whole, 30.9 percent of all children of secondary school age attend secondary school. Among boys, the secondary NAR is 35.1 percent, compared to 26.6 percent among girls. As at the primary level, the disparities linked to the area of residence and to household wealth are larger than the disparities linked to gender. In urban areas, the secondary NAR is 50.6 percent and in rural areas it is 28.7 percent. One likely explanation for this difference is the scarcity of secondary schools in rural Nepal. The link between poverty and school attendance at the secondary level of the education system is even stronger than at the primary level. For children from the richest 20 percent of all households, the secondary NAR is 57.0 percent. Among the poorest 20 percent of all households the secondary NAR is 14.6 percent, less than a quarter of the NAR in the richest households.

Figure 2: Secondary school attendance in Nepal
Bar graph showing secondary school net attendance rate in Nepal
Source: Nepal 2001 Demographic and Health Survey (DHS).

In conclusion, whereas Nepal has been able to move towards gender disparity in its education system, children from rural areas and from poorer households continue to be at a great disadvantage.

Note: In this article, the primary school NAR is defined as the share of children of primary school age who are attending primary or secondary school. Attendance at the secondary level is included because children of primary school age in secondary school would otherwise be counted as out of school. Similarly, the secondary school NAR counts children of secondary school age in secondary or higher education as attending secondary school.

Related articles
External links
Friedrich Huebler, 30 April 2007 (edited 12 October 2008), Creative Commons License
Permanent URL: http://huebler.blogspot.com/2007/04/primary-and-secondary-school-attendance.html