Sunday, August 28, 2005

Primary school attendance in India

Today I will begin a series of posts that take a closer look at gender disparity in school attendance. Goal 3 of the Millennium Development Goals calls for the promotion of gender equality and the empowerment of women. The targets listed under this goal include the elimination of gender disparity in primary and secondary education, preferably by 2005, and at all levels of education no later than 2015.

Education statistics published by UNESCO are mostly based on administrative records of enrollment. Data from household surveys are an alternative source of statistics on school attendance. Because household surveys collect data on various characteristics of children and the households they live in it is possible to analyze gender disparity in more detail than with national enrollment data on primary or secondary education.

With household survey data a child is counted as being in school if one of the following two conditions is met:
  1. The child attended school during the week preceding the survey.
  2. The child was in school anytime during the year preceding the survey. This condition is added to account for children who were not in school because they were ill, because they were on vacation, or for other reasons.
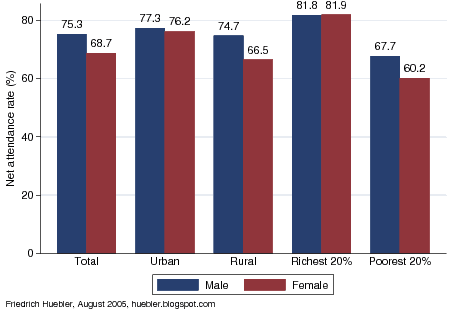
In India, one of the most recent surveys is a Multiple Indicator Cluster Survey (MICS) that was conducted in 2000. Overall, 72.1% of all children of primary school age (6-10 years) were attending primary school according to the data from the India MICS (see also the graph in a previous post). The graph below presents the primary school NAR for boys and girls disaggregated by the area of residence and by household wealth.

Primary school net attendance rate, India 2000
Bar chart with male and female primary school net attendance rate in India, 2000
Data source: India 2000 MICS.

In the country as a whole, more boys than girls go to primary school. The NAR of boys is 6.6% higher than the NAR of girls (see the table below). This gender disparity at the country level is clearly driven by the patterns of school attendance in rural areas and in poor households. In urban areas and among the richest 20% of the population, boys' and girls' attendance rates are virtually identical. Rural families and those from the poorest 20% of the population, on the other hand, are likely to send only boys to school when they cannot afford education for all their children. To reach the Millennium Development Goal of gender parity, policy makers have to focus their efforts on rural India and on households that suffer from poverty.

Primary school net attendance rate, India 2000

Total
NAR (%)
Male NAR (%)Female NAR (%)Difference
male- female
GPI
female/ male
Urban76.877.376.21.10.99
Rural70.774.766.58.20.89
Richest 20%81.981.881.9-0.11.00
Poorest 20%64.067.760.27.50.89
Total72.175.368.76.60.91
GPI: gender parity index. - Data source: India 2000 MICS.

Friedrich Huebler, 29 August 2005 (edited 27 January 2007), Creative Commons License.

Monday, August 22, 2005

Education data from household surveys

Education statistics published by the UNESCO Institute for Statistics rely on two sources of data: (a) administrative records of enrollment that are provided by national governments and (b) population statistics from the United Nations Population Division. For example, the primary school net enrollment rate is calculated as follows:
  • Primary school NER = children of primary school age enrolled in primary school / total population of primary school age
The numerator uses national enrollment data and the denominator population data from the UN Population Division. This combination of data from two different sources can lead to errors in the calculation of indicators like the NER. Estimates by the UN Population Division may not match the actual population figures in a country. Local schools, whose records are aggregated at the national level, may misstate enrollment to obtain financing and governments may do the same to meet objectives like the Millennium Development Goals. A further limitation of education statistics based on administrative records is that they provide little information about the characteristics of students beyond age and sex. In spite of these concerns, the data published by UNESCO remains the most comprehensive collection of global education statistics.

Household surveys are an alternative source of data on education. Because survey data is collected at the household level, it is possible to capture a large amount of additional information on children and the households and communities they live in. In contrast to records of enrollment, household surveys also provide data on children out of school that can be analyzed to guide policies aimed at increasing school enrollment rates.

Estimates derived from surveys use a single source of data, which minimizes problems that arise from the combination of data from different sources. However, the estimates are affected by two other types of errors: sampling errors and nonsampling errors. Sampling errors arise because surveys cover only a part of the population and estimates are therefore not identical to those that would be obtained by surveying the entire population of a country. Nonsampling errors are the result of mistakes during data collection and data processing, for example incorrect responses by survey respondents and mistakes during data entry. Sampling errors can be minimized by selecting a sufficiently large sample and nonsampling errors can be minimized through training of survey staff.

Two household survey programs that focus on developing countries are the Demographic and Health Surveys (DHS) and the Multiple Indicator Cluster Surveys (MICS). The DHS were initiated by the U.S. Agency for International Development (USAID) in the 1980s to provide data on population and health trends. The MICS program was developed by UNICEF in the 1990s to monitor the situation of women and children.

Both the DHS and the MICS collect data on school attendance. As an example I show estimates for the primary school net attendance rate (NAR) from the 2000 MICS in India. The primary school NAR is calculated as follows:
  • Primary school NAR = number of children of primary school age that are attending primary school / number of children of primary school age
Similar to the NER, the maximum value of the NAR is 100%. In the India MICS, 72.1% of all children of primary school age (6-10 years) were found to be in primary school. Attendance rates were higher among boys than girls (75.3% vs. 68.7%). NER data from UNESCO limits the analysis to a breakdown by sex but with survey data we can also analyze other disparities. In India, for example, urban children (NAR 76.8%) are more likely to attend primary school than rural children (NAR 70.7%). Household wealth is also an important determinant of school attendance. Among the poorest 20% of all households, only 64.0% of children attend primary school, compared to 81.9% of children from the richest 20% of all households.

Primary school net attendance rate, India 2000
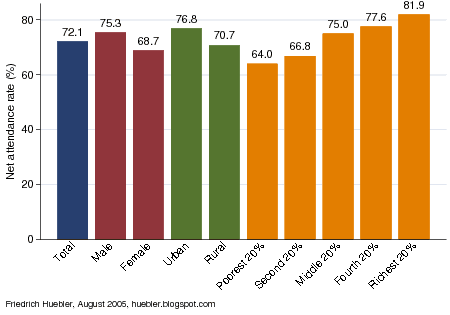
Bar chart with primary school net attendance rate in India, 2000
Data source: India 2000 MICS.

In the coming weeks I will present more education data from household surveys. By providing detailed information on the determinants of school attendance at the household level, surveys are an important tool for policy makers and for researchers and organizations that work in the area of education.

Related articles
Friedrich Huebler, 22 August 2005 (edited 12 October 2008), Creative Commons License
Permanent URL: http://huebler.blogspot.com/2005/08/education-data-from-household-surveys.html
.

Monday, July 25, 2005

Pre-primary education

Pre-primary or preschool education is targeted at children below the official primary school starting age. The content of national programs of pre-primary education varies, but the common goal is to introduce children to a school-type environment. Such programs set the foundation for lifelong learning and help countries reach the Millennium Development Goal of universal primary education.

The Global Education Digest 2005 from UNESCO has statistics on participation in pre-primary education for the school year 2002/03. The net enrollment ratio (NER) is listed for 149 countries, the gross enrollment ratio (GER) for 180 countries. The NER is the share of children of preschool age who are enrolled in preschool. The GER is the number of children in preschool, regardless of age, divided by the population of preschool age.
  • NER = number of children of preschool age in preschool / number of children of preschool age
  • GER = number of children in preschool / number of children of preschool age
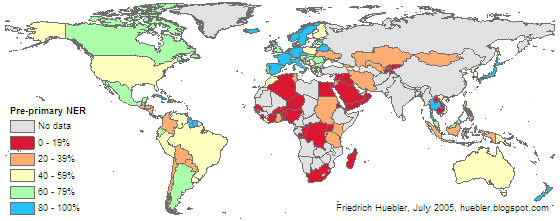
The maximum value for the NER is 100% while the GER can exceed 100%. In a previous post I demonstrated that the difference between NER and GER at the primary level can be quite large. This is often the case in Sub-Saharan Africa because of delayed entry into primary school. At the pre-primary level, the difference between NER and GER is much smaller, as a comparison of the two maps below shows.

For most countries the pre-primary NER and GER lie in the same range although there are notable exceptions, among them Australia, South Korea, and the Ukraine. For this reason, and because the GER is available for more countries, I focus on the GER to describe participation at the pre-primary level of education.

Pre-primary net enrollment ratio, 2002/2003
Map of the world showing pre-primary net enrollment ratio for each country in 2002/03
Data source: UNESCO Institute for Statistics (UIS). 2005. Global Education Digest 2005. Montreal: UIS.

Pre-primary gross enrollment ratio, 2002/2003
Map of the world showing pre-primary gross enrollment ratio for each country in 2002/03
Data source: UNESCO Institute for Statistics (UIS). 2005. Global Education Digest 2005. Montreal: UIS.

The lower graph presents the pre-primary GER in the school year 2002/03. The GER is above 80% in most industrialized countries, but also in some countries of East Asia (for example Malaysia and Thailand), Latin America (for example Cuba and Mexico), and Eastern Europe (Belarus and Russia). The pre-primary GER is lowest in Africa and the Middle East, with most countries in the range below 20%. Low GER values are also observed in Central, South, and East Asia. In Sub-Saharan Africa this pattern of low participation continues at the primary level, while in East Asia primary school enrollment rates are significantly higher.

Friedrich Huebler, 25 July 2005, Creative Commons License.

Sunday, July 17, 2005

Transition from primary to secondary education

Statistics on primary and secondary school enrollment from the Global Education Digest 2005 by UNESCO indicate that few children in Africa continue their education past the primary level. The percentage of children enrolled in the last grade of primary school who continue their education at the secondary level is known as the transition rate from primary to secondary education.

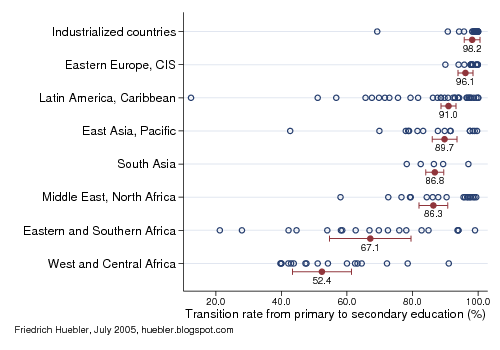
The following graph shows the transition rate from primary to secondary education for 147 countries for which the Global Education Digest 2005 has data. The blue circles indicate the transition rate in each country. The red marks indicate the average transition rate in each region and the 95% confidence interval for this average.

Transition rate from primary to secondary education, 2002/03
Graph showing transition rate from primary to secondary education by region
Data source: UNESCO Institute for Statistics (UIS). 2005. Global Education Digest 2005. Montreal: UIS.
Note: Regional averages are weighted by each country's population of primary school age.


Worldwide, 85% of children in the last grade of primary school go on to attend secondary school (see the table below). Only two regions have transition rates below this global average: Eastern and Southern Africa (67.1%), and West and Central Africa (52.4%). Transition rates are highest in the industrialized countries (98.2%) and in Eastern Europe and the CIS countries (96.1%). However, even in Sub-Saharan Africa some countries have transition rates above 80%.

Transition rate from primary to secondary education, 2002/03
RegionTransition rate (%)
MaleFemaleTotal
East Asia, Pacific89.889.789.7
Eastern and Southern Africa67.466.667.1
Eastern Europe, CIS98.898.796.1
Industrialized countries98.198.198.2
Latin America, Caribbean92.091.391.0
Middle East, North Africa86.486.186.3
South Asia84.589.586.8
West and Central Africa54.649.452.4
World84.485.485.1
Data source: UNESCO Institute for Statistics (UIS). 2005. Global Education Digest 2005. Montreal: UIS.
Note: Regional values are weighted by each country's population of primary school age.


The difference between male and female transition rates is negligible, except for two regions: South Asia, and West and Central Africa. In South Asia, girls are more likely to transfer to secondary school; the transition rate is 89.5% for girls and 84.5% for boys. In West and Central Africa, the opposite can be observed; here the transition rate is 54.6% for boys and 49.4% for girls. Girls in this region are thus doubly disadvantaged. Not only do they have very low primary school enrollment rates, they are also less likely to continue their education at the secondary level.

Friedrich Huebler, 17 July 2005, Creative Commons License

Sunday, July 10, 2005

Primary and secondary school enrollment

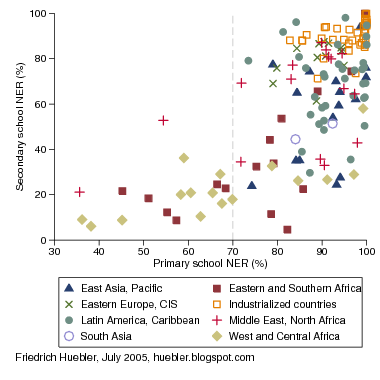
Not all children who attend primary school continue their education at the secondary level. At the global level, the secondary school net enrollment ratio (NER) is 59.3%, compared to a primary school NER of 83.8%, but primary and secondary school participation vary widely between individual countries. With data from the Global Education Digest 2005 by UNESCO the correlation between primary and secondary school enrollment can be analyzed.

In the graph below, the primary school NER is plotted along the horizontal axis and the secondary school NER along the vertical axis. 151 countries are shown, with symbols that indicate the UNICEF region to which they belong. For the remaining countries the Global Education Digest contains no data on primary or secondary school enrollment.

Primary and secondary school net enrollment ratio, 2002/03
Graph with primary and secondary school net enrollment rates
Data source: UNESCO Institute for Statistics (UIS). 2005. Global Education Digest 2005. Montreal: UIS.

The secondary school NER does not increase proportionally with primary school enrollment. In 19 of the countries in the graph, the primary school NER is less than 70%; in 17 of these countries the secondary school NER does not rise above 30%. All countries in this group are from Africa or the Middle East. If the primary school NER in a country is above 70%, children are much more likely to continue their education at the secondary level. However, even in this group many countries, mostly from Africa, are struggling to raise secondary school enrollment.

In the following table, all countries are grouped according to the primary school NER. For each group, the average secondary school NER and the number of countries in the group are listed. Secondary school enrollment does increase with primary school enrollment but for countries with a primary school NER above 70% this increase in secondary school enrollment is relatively steeper. In the 86 countries with a primary school NER above 90%, on average three out of four children of secondary school age (73.8%) go to secondary school.

Average secondary school net enrollment ratio by level of primary school net enrollment, 2002/03
Primary school NERAverage secondary school NER (%)Number of countries
30 to 39.9%8.0
3
40 to 49.9%18.8
2
50 to 59.9%24.4
6
60 to 69.9%25.8
8
70 to 79.9%36.4
12
80 to 89.9%53.3
34
90 to 100%73.8
86
Total59.7
151
Data source: UNESCO Institute for Statistics (UIS). 2005. Global Education Digest 2005. Montreal: UIS.
Note: Average values are weighted by each country's population of secondary school age.


Friedrich Huebler, 10 July 2005, Creative Commons License

Monday, June 6, 2005

Update to "Integrating Stata and external text editors"

I have rewritten my guide to Integrating Stata and external text editors. The guide describes how a text editor can be fully integrated with the Stata statistical package, similar to the simple editor that is part of Stata. For this purpose I developed two AutoIt scripts that are now available in a new version 2.0.

New features:
  • Support for Stata 9 added, the latest release of Stata. The scripts are now compatible with Stata 7, 8, and 9.
  • The scripts work with more than one instance of Stata.
  • Scripts do no longer rely on the built-in Stata editor.
The new scripts were made possible with help from Nicholas Winter, who updated my old scripts to be compatible with Stata 9 and suggested several ways to make them more efficient. Additional acknowledgements can be found at the end of the guide.

Update, 9 June:
  • Version 2.1 of scripts released.
  • Fixed problem with the clipboard that was reported by some users.
Update, 30 June:
  • Version 2.1.1 of rundolines script released, with minor bug fix.
Related articles:
- Integrating Stata and external text editors
- Creating maps with Stata
- Creating PNG images with Stata
- Reading Statalist with Gmail

Friedrich Huebler, 6 June 2005 (edited 10 February 2006), Creative Commons License

Wednesday, June 1, 2005

Secondary school enrollment 2002/03

The Millennium Development Goals do not require that all children attend secondary school, instead they only ask for gender parity at the secondary level by the year 2015. Nevertheless, participation in secondary education is an important indicator because at this level children acquire more specialized knowledge than in primary school, which enables them to be more competitive in the labor market than their less educated peers.

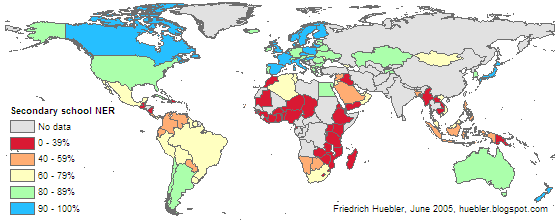
The Global Education Digest 2005 contains the latest data on secondary school enrollment, for the 2002/03 school year. The secondary school net enrollment ratio (NER) - the share of children of secondary school age that are currently enrolled in secondary school - is known for fewer countries than the primary school NER. No data on secondary school enrollment is available for China, Russia, virtually all of South Asia, and many countries in the Middle East and Africa (see the map below). Overall, the Global Education Digest lists the secondary school NER for 165 countries while the primary school NER is provided for 181 countries.

Secondary school net enrollment ratio, 2002/2003
Map of the world showing secondary school net enrollment rate for each country in 2002/03
Data source: UNESCO Institute for Statistics (UIS). 2005. Global Education Digest 2005. Montreal: UIS.

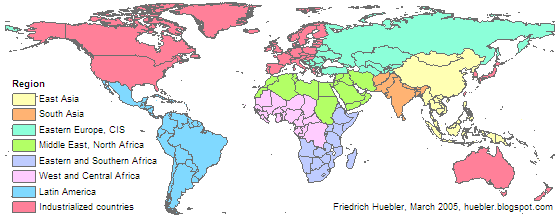
In spite of the lack of data, it is possible to compare individual regions. For this purpose I adopt the regions used by UNICEF, shown in the following map.

UNICEF regions
Map of the world showing UNICEF regions
Source: UNICEF website, March 2005.

At the global level, 59% of all children of secondary school age, boys as well as girls, were enrolled in secondary school. The secondary school NER is highest among industrialized countries (91%) and in the Eastern Europe/CIS region (82%). Three regions are around the global average: Latin America and the Caribbean (67%), Middle East and North Africa (58%), and East Asia and the Pacific (54%).

Secondary school enrollment is lowest in Eastern and Southern Africa (23%), West and Central Africa (25%), and South Asia (45%; note that this average is based on two countries only: Bangladesh and the Maldives).

Secondary school net enrollment ratio, 2002/03
RegionSecondary school NER (%)
MaleFemaleTotal
East Asia, Pacific51.152.054.4
Eastern and Southern Africa24.521.823.2
Eastern Europe, CIS82.281.882.0
Industrialized countries90.591.991.2
Latin America, Caribbean64.769.066.8
Middle East, North Africa60.955.658.3
South Asia42.2*46.9*44.5*
West and Central Africa28.220.924.7
World59.159.059.3
Data source: UNESCO Institute for Statistics (UIS). 2005. Global Education Digest 2005. Montreal: UIS.
Notes: (1) Regional values are weighted by each country's population of secondary school age. - (2) The male and female NER is available for fewer countries than total NER. This explains why
the total NER is greater than the male and female NER in East Asia and at the global level. - * Sample size too small to be representative for region.

At the primary level, girls' NER is usually below that of boys but this is not true at the secondary level. In two regions - Latin America and South Asia - girls are more likely to be enrolled in secondary school than boys. In three regions - Eastern and Southern Africa, West and Central Africa, and the Middle East and North Africa - boys are more likely to be in secondary school. The remaining three regions - East Asia and the Pacific, Eastern Europe/CIS, and the industrialized countries - are close to the Millennium Development Goal of gender parity in secondary education.

Friedrich Huebler, 1 June 2005 (edited 16 July 2005), Creative Commons License