Sunday, May 18, 2008

UNESCO releases data from 2007 education survey

The UNESCO Institute for Statistics (UIS) has released the data from its latest survey of international education indicators, conducted in 2007. The UIS Data Centre offers annual data for 208 countries and territories from the years 1999 to 2007. The previous survey had data for 207 countries and territories but starting in 2008, Serbia and Montenegro are listed separately, after both countries had declared their independence in 2006.

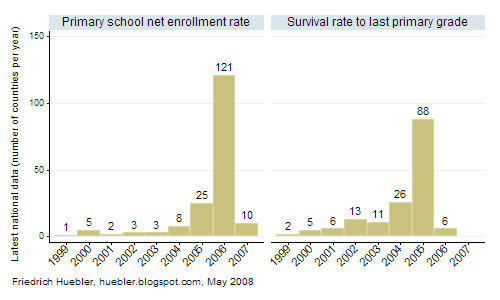
The graph below presents the distribution of the latest UIS data for two official Millennium Development Goal indicators, the primary school net enrollment rate (NER) and the survival rate to the last grade of primary school.

The primary NER is available for 178 countries. In 121 countries, the latest data is from 2006. For 10 countries - Egypt, Ethiopia, Ghana, Kazakhstan, Marshall Islands, Saint Kitts and Nevis, Sao Tome and Principe, Serbia, South Korea, and Vanuatu - the primary NER in 2007 is available.

The survival rate to the last grade of primary school is available for 157 countries. To calculate this indicator, data from two consecutive years is needed. For this reason, the latest available data for 88 of the 157 countries is from 2005. For 6 countries - Egypt, Ethiopia, Kazakhstan, Sao Tome and Principe, South Korea, and Tanzania - the survival rate for 2006 is provided in the UIS database.

Distribution of latest national data from UIS education survey 2007
Histogram showing annual distribution of latest data from UIS education survey 2007
Source: UNESCO Institute for Statistics, Data Centre, May 2008

Related articles
External links
Friedrich Huebler, 18 May 2008 (edited 26 October 2008), Creative Commons License
Permanent URL: http://huebler.blogspot.com/2008/05/uis.html

Saturday, May 10, 2008

Adult literacy in sub-Saharan Africa

Literacy data published by the UNESCO Institute for Statistics (UIS) in 2007 shows that the lowest adult literacy rates are observed in Africa and South Asia. In some countries, fewer than three out of ten adults can read and write. UIS provides national literacy data for two age groups: youths aged 15 to 24 years, and adults aged 15 years and older. A more detailed analysis of literacy is possible with data from household surveys.

Most Demographic and Health Surveys (DHS) collect data on literacy for persons between 15 and 49 years. For male household members, literacy data is sometimes collected up to an age of 54, 59, or 64 years. To assess the degree of literacy, respondents to the survey are asked to read a card with a simple sentence. If a respondent can read the whole sentence, he or she is counted as literate, in accordance with UNESCO's definition of literacy as "the ability to read and write, with understanding, a short simple sentence about one’s everyday life". Recent Multiple Indicator Cluster Surveys (MICS) by UNICEF collect data on literacy with the same method, but only for female household members between 15 and 49 years. MICS surveys are therefore not covered by the analysis that follows.

This article examines data from eight DHS surveys that were carried out in sub-Saharan Africa between 2003 and 2006. The survey data is from Benin (2006), Burkina Faso (2003), Cameroon (2004), Lesotho (2004-05), Niger (2006), Nigeria (2003), Uganda (2006), and Zimbabwe (2005-06). The data can be used to calculate overall literacy rates and also to examine trends over time by comparing literacy rates in different age groups.

The following table lists literacy rates for the male, female, and total population between 15 and 49 years of age. Zimbabwe (85%) and Lesotho (79%) are the countries with the highest literacy rates, followed by Cameroon (63%), Uganda (58%), and Nigeria (55%). In Benin (33%), Burkina Faso (18%), and Niger (13%), adult literacy rates are much lower. In seven of the eight countries there is a large difference between male and female literacy rates. In Benin, Burkina Faso, Cameroon, Niger, Nigeria, and Uganda, more men than women are literate, with a gender gap ranging from 12% to 26%. In Lesotho, the literacy rate of women is 21% greater than the literacy rate of men. In Zimbabwe, the difference between the male and female literacy rate is only 6%.

Adult literacy rate (%), population 15-49 years
Country
Male Female Total
Benin 45.1 21.8 32.6
Burkina Faso 24.3 11.9 17.6
Cameroon 70.6 54.8 62.5
Lesotho 68.8 90.1 79.4
Niger 20.9 7.5 13.2
Nigeria 68.4 42.8 54.9
Uganda 68.6 48.9 58.4
Zimbabwe 87.9 81.5 84.5
Source: Demographic and Health Surveys 2003-2006

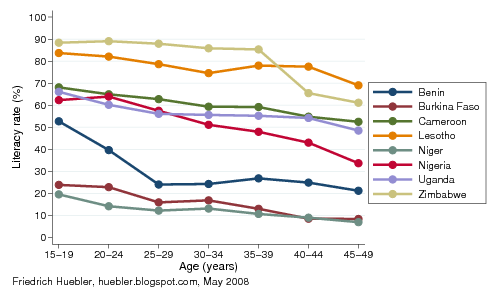
For the graph below, the survey respondents were divided into five-year age groups. In all countries, literacy rates among the younger population are higher than among the older population. The literacy rate of the youngest group, 15 to 19 years, can be interpreted as a measure of the coverage and quality of the primary school system during the 1990s, when the members of this age group were of primary school age.

In Burkina Faso, Cameroon, Lesotho, Niger, and Uganda, the difference between the literacy rates of 15- to 19-year-olds and 45- to 49-year-olds ranges from 13% to 18%. These numbers indicate a relatively modest expansion of the education system between the 1960s, when the older age group was of primary school age, and the 1990s. In contrast, in Benin, Nigeria, and Zimbabwe, the difference between the literacy rates of 15- to 19-year-olds and 45- to 49-year-olds ranges from 27% to 32%. These three countries were thus more successful in their efforts to increase the number of literate citizens than the other five countries.

In Burkina Faso and Niger, less than one quarter of the population between 15 and 19 years can read and write. However, the case of Benin shows that a large increase in literacy can be achieved within only ten years. In Benin, only 24% of 25- to 29-year-olds are literate but among 15- to 19-years-olds the literacy rate has grown to 53%.

Adult literacy by five-year age group
Graph with adult literacy rates by age in sub-Saharan Africa
Source: Demographic and Health Surveys 2003-2006

Related articles

External links

Friedrich Huebler, 10 May 2008, Creative Commons License
Permanent URL: http://huebler.blogspot.com/2008/05/literacy.html

Sunday, April 27, 2008

Guide to integrating Stata and external text editors

Download: rundo4.zip (242 KB), rundolines4.zip (243 KB), updated 14 August 2011

Table of contents

1. Introduction
2. Requirements
3. Installation
4. Using the programs
5. Known problems and troubleshooting
6. Acknowledgments
7. History of the programs

1. Introduction

Stata is a statistical package that is available for Windows, Macintosh and Unix operating systems. This guide addresses some shortcomings of the text editor that is part of the Stata package. Stata's Do-File Editor is fully integrated and commands can be executed directly from the editor with a keyboard shortcut or the click of a button. External editors often have a richer set of features, including syntax highlighting, but they lack integration with Stata.

This document describes how external text editors can be integrated with Stata in a way similar to the Do-File Editor. Two free programs are offered for this purpose: rundo.exe allows the execution of complete Stata do-files from an external editor, and rundolines.exe allows the execution of selected Stata commands from an external editor. Both programs can be installed and used together or individually.

2. Requirements
  • MS Windows: The programs were tested with Windows XP, Windows Vista and Windows 7 and should work with older versions of Windows. Macintosh and Unix operating systems are not supported.
  • Stata: The programs were tested with Stata versions 8, 9, 10 and 11 (up to version 11.2). Support for Stata 12 was added in August 2011.
  • Text editor: The programs were tested with Notepad++ 4.8.2 and later versions. They have also been confirmed to work with ConTEXT, Crimson Editor, EditPlus, EmEditor, PSPad, TextPad, TeXnicCenter, and UltraEdit. In addition, previous versions of the programs were reported to work with gVim, Hidemaru, jEdit, SciTE, Vim, and WinEdt.
  • rundo.exe version 4 and rundolines.exe version 4: Download rundo4.zip (242 KB) and rundolines4.zip (243 KB).
Please contact the author at fhuebler@gmail.com if you use the programs with any editor besides ConTEXT, Crimson Editor, EditPlus, EmEditor, Notepad++, PSPad, TextPad, TeXnicCenter, and UltraEdit, so that the list of supported text editors can be updated. Thank you.

3. Installation

The integration of an external text editor with Stata can be accomplished with three simple steps:
  1. Download and extract the rundo and rundolines programs.
  2. Edit the INI files.
  3. Find a way to call rundo.exe and rundolines.exe from the text editor with a keyboard shortcut, a menu entry, or an icon in the toolbar.
Step 1: Download the rundo and rundolines programs and save the contents of the two ZIP files anywhere on your computer. One suggested location is the personal ADO directory of Stata, usually C:\ado\personal\. Each ZIP archive contains three files: the executable, the source code, and an INI file.

The programs were written and compiled with AutoIt version 3.2.12.1. Users who prefer to compile the programs themselves can do so with the included source code.

Step 2: Edit the INI files for the rundo and rundolines programs. rundo.ini and rundolines.ini are identical and list six options that must be edited to match the user's setup.
  • statapath is the path to the Stata executable, enclosed in quotes, for example "C:\Program Files\Stata11\StataSE.exe".
  • statawin is the title of the Stata window, also enclosed in quotes, for example "Stata/SE 11.2". The window title is shown in the upper left corner of the main Stata program window (see Figure 1 with the program window of Stata/SE 10.1).
  • statacmd is the keyboard shortcut to the Stata command window. In Stata versions 8 to 11, the shortcut is Ctrl+4 (written as "^4" in the INI file). In Stata 12, released in July 2011, the shortcut was changed to Ctrl+1 (written as "^1" in the INI file).
  • clippause is a pause after Stata commands are copied to the Windows clipboard.
  • winpause is a pause between window-related operations, for example between the switch from the text editor to Stata.
  • keypause is the pause between individual key strokes that are sent to Stata.
The last three options are specified in milliseconds. The default values should work for most users but they can be reduced for a faster execution of the rundo and rundolines programs. If the pauses are too short, the programs fail and no commands are passed on to Stata.

Figure 1: Stata program window
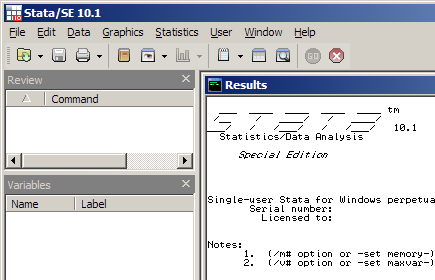
Stata program window with title in upper left corner

Step 3: Find a way to call rundo.exe and rundolines.exe from the text editor with a keyboard shortcut, a menu entry, or an icon in the toolbar. This example shows how the programs can be linked to Notepad++, a free text editor for MS Windows. For Stata users, an optional language file for syntax highlighting is available in the Notepad++ download section. Other text editors can also be integrated with Stata if they provide an option to call the rundo and rundolines programs; many editors have this capability.
  1. rundolines:
    • In Notepad++, go to the Run menu and select Run.
    • Browse to rundolines.exe and enclose the entire path in quotes. For example, if rundolines.exe is saved in the directory C:\ado\personal\, the complete entry in the Run box of Notepad++ would be:
      "C:\ado\personal\rundolines.exe"
    • Click Save.
    • Enter a name, for example "Run do-lines", and select a shortcut, for example F9 (see Figure 2).
    • Click OK, click Cancel.
  2. rundo:
    • In Notepad++, go to the Run menu and select Run.
    • Browse to rundo.exe enclose the entire path in quotes. Next, add the text "$(FULL_CURRENT_PATH)" (with quotes) after the path to rundo.exe. For example, if rundo.exe is saved in the directory C:\ado\personal\, the complete entry in the Run box of Notepad++ would be:
      "C:\ado\personal\rundo.exe" "$(FULL_CURRENT_PATH)"
    • Click Save.
    • Enter a name, for example "Run do-file", and select a shortcut, for example F10 (see Figure 3).
    • Click OK, click Cancel.
Figure 2: Notepad++ shortcut setup for rundolines program
Notepad++ dialog to add the rundolines program

Figure 3: Notepad++ shortcut setup for rundo program
Notepad++ dialog to add the rundo program

4. Using the programs

After the programs have been successfully installed, Stata commands can be executed directly from the text editor. In the case of Notepad++, press F10 (or any other assigned shortcut) to run a saved Stata do-file. To run only a few commands, highlight the relevant lines in the editor and then press F9 (or any other assigned shortcut).

The rundo program sends the path of the do-file to the Stata Command window, preceded by the word "do" and followed by Enter. If more than one instance of Stata is open, the do-file is executed in the Stata window that was most recently active. If Stata is not open, the rundo program starts Stata and then runs the do-file. Note that a do-file must be saved before the rundo program is called because it looks for the saved version of the document that is currently being edited. An alternative would be to first select the entire text in the editor and then call the rundolines program, which passes all selected lines to Stata.

The rundolines program saves the highlighted lines in a temporary file and then sends the path of the temporary file to the Command window in Stata, preceded by "do" and followed by Enter. If more than one instance of Stata is open, the commands are executed in the Stata window that was most recently active. If Stata is not open, the rundolines program starts Stata and then runs the selected commands.

The rundo and rundolines programs are self-contained, they do not create any files besides a temporary file with Stata commands, and they make no changes to the Windows registry. As the source code shows, the only function of the programs is to copy commands from the text editor and pass them on to Stata. However, both programs overwrite the contents of the Windows clipboard directly after they are executed because the clipboard is used to store the path to the Stata do-file.

5. Known problems and troubleshooting

Users who encounter problems during the installation or execution of the rundo and rundolines programs are advised to follow the troubleshooting steps in this section.

Known problem 1: If the rundo and rundolines programs fail, the clippause, winpause and keypause values may be too small. In that case, edit rundo.ini and rundolines.ini, increase the pause values (especially for winpause and clippause), and then run the programs again. For best results, the values in the INI files are long enough so that the rundo and rundolines programs do not fail and short enough to avoid noticeable delays before the execution of the commands in Stata. The default values in the INI file should work on most systems.

Known problem 2: A second known problem involves keyboard shortcuts to rundo.exe and rundolines.exe that use combinations with Shift or Ctrl, for example Shift+F9 or Ctrl+F10. Such shortcuts can result in a "stuck" Shift or Ctrl key in Stata. This problem affects Notepad++ and other editors. Shortcuts without Shift or Ctrl are therefore preferred.

Known problem 3: After an update of Stata, for example from version 11.0 to version 11.1, the rundo and rundolines programs may stop functioning if the title of the Stata window has changed (see Figure 1). If this is the case, edit the statawin entries in the rundo.ini and rundolines.ini files to reflect the correct window title.

Troubleshooting: The rundo and rundolines programs should work if the installation instructions are followed exactly. If the programs do not work, please use the steps below to test your setup. I recommend testing the rundolines program first because its internal code is less complicated than the code for the rundo program.
  1. Save rundolines.exe and rundolines.ini in the same folder, as described in Step 1 of the installation instructions above. Do not edit and recompile the AU3 file.
  2. Edit the rundolines INI file as described in Step 2 of the installation instructions.
  3. Add a link to Notepad++ as described in Step 3 of the installation instructions.
  4. Start Stata.
  5. Start Notepad++ and type one or more Stata commands, for example "dir" (without quotes).
  6. Highlight the Stata commands in Notepad++ with the mouse or by pressing Ctrl+A.
  7. Press F9 (or any other shortcut that was assigned to rundolines.exe) to call the rundolines program. Stata should now run the commands from Notepad++. If the commands are not executed, the rundolines program cannot find Stata because the window title in the INI file is incorrect. If this is the case, edit rundolines.ini to match the title of the Stata program window, as shown in the installation instructions. For example, note the difference between "Stata" and "Stata/SE". Save the INI file and repeat steps 4 to 7 until it is possible to run commands from Notepad++ in a copy of Stata that is already open. Move on to the next step.
  8. Close Stata but keep Notepad++ open.
  9. Highlight all Stata commands in Notepad++ with the mouse or by pressing Ctrl+A.
  10. Press F9 (or any other shortcut assigned to rundolines.exe) to call the rundolines program. Stata should now start and run the commands from Notepad++. If Stata does not start, review the rundolines.ini file and make sure that the path to the Stata executable is correct. For example, note the difference between wstata.exe and wsestata.exe. Save the INI file and repeat steps 8 to 10.
When the rundolines program works as expected, the troubleshooting steps can be repeated for the rundo program. However, rundo.exe is more complex than rundolines.exe and may not be compatible with as many editors as the rundolines program. This possible limitation can be overcome by using rundolines instead of rundo: to run an entire Stata do-file simply highlight all text in the editor (usually by pressing Ctrl-A) and then call rundolines.exe.

6. Acknowledgments

The rundo and rundolines programs are based on previous work by Dimitriy Masterov and Eva Poen. Masterov demonstrated in a post to the Stata mailing list how a do-file can be executed from Vi. Poen showed how individual lines can be executed from WinEdt. Nicholas Winter suggested changes to the programs that made them more efficient and solved some problems with the Windows clipboard. Jeffrey Arnold described how INI files can be used to set program parameters, making it possible to distribute precompiled and thus more user-friendly versions of the rundo and rundolines programs.

Others tested the programs with different editors, suggested modifications, or provided general feedback. For this, I would like to thank the following persons: Alexey Bessudnov, Nicholas Cox, Marcos Delprato, Matthew Forbes, Ari Friedman, Stefan Gawrich, Masakazu Hojo, Changhwan Kim and Haebong Woo, Keith Kranker, Randall Lewis, Kieran McCaul, Salmai Qari, Tomoyo Sakiyama, Alonso Sánchez, Raul Sanchez, Sven-Oliver Spieß, Timm Sprenger, Francisco Tschen, Renato Vargas, Robert White, Ansgar Wolsing, Amanda Tzy-Chyi Yu, and Markus Zielonka.

7. History of the programs
  • July 2004: First version of rundolines.au3 sent to the Stata mailing list (see Statalist archive).
  • October 2004: First version of this guide, with both scripts, released as part of "Some notes on text editors for Stata users".
  • March 2005: Scripts revised to work with Stata 7 and 8.
  • March 2005: Expanded guide added to my blog on international education statistics.
  • April 2005: Guide and scripts added to my website, with direct download links.
  • 6 June 2005: Version 2.0 of scripts released, with support for Stata 9. The scripts are now compatible with Stata 7, 8, and 9. Scripts work with more than one instance of Stata. Scripts no longer rely on the built-in editor of Stata. New version of this guide.
  • 8 June 2005: Version 2.1 of scripts released. Fixed problem with the clipboard that was reported by some users: scripts no longer attempt to restore clipboard or text in Stata Command window.
  • 30 June 2005: Version 2.1.1 of rundolines script released, with minor bug fix related to clipboard.
  • 26 September 2005: Version 2.2 of scripts released. The scripts are now compatible with Stata 9.1, released on 15 September 2005.
  • 22 June 2006: New section added to the guide: Supported editors.
  • 28 January 2007: The list of supported editors now includes EmEditor, gVim, Hidemaru, jEdit, Notepad++, SciTE, TextPad, Vim, UltraEdit, and WinEdt.
  • 26 April 2008: The following editors have been confirmed to work with the scripts: Crimson Editor, EditPlus, EmEditor, gVim, Hidemaru, jEdit, Notepad++, SciTE, TextPad, Vim, UltraEdit, and WinEdt.
  • 27 April 2008: Version 3 of the rundo and rundolines programs was released. The programs are now precompiled and no longer require installation of AutoIt. On the occasion of the new release, the previous guide to integrating Stata with external text editors was replaced by a new version of the guide.
  • 22 June 2008: Section on troubleshooting added to this guide.
  • 12 October 2008: The rundo and rundolines programs have been confirmed to work with Windows Vista. The acknowledgments section of this guide was expanded.
  • 8 January 2009: The section on known problems and other parts of the guide were revised.
  • 30 March 2009: Version 3.1 of the rundo and rundolines programs was released, with a bugfix. Version 3 of rundo.exe pointed to rundolines.ini instead of rundo.ini. Users who had only installed the rundo program received an error message when they tried to execute a do-file. The code of rundo.exe and rundolines.exe was also updated to version 10.1 of Stata. Both programs continue to work with older versions of Stata.
  • 31 August 2009: INI files updated to support Stata 11.
  • 17 April 2011: INI files updated to support Stata 11.2.
  • 14 August 2011: Version 4 of the rundo and rundolines programs was released. The new programs support Stata 12, released in July 2011. To be compatible with all versions of Stata, it was necessary to add an option to specify the keyboard shortcut to the Stata command window. In Stata versions 8 to 11 the keyboard shortcut is Ctrl+4, in Stata 12 it is Ctrl+1. Users who upgrade from an older version of Stata to Stata 12 must install version 4 of the rundo and rundolines programs. Users of Stata 11 or previous versions of Stata can continue to use version 3.1 of the programs, which have been archived at these links: rundo3.zip (240 KB), rundolines3.zip (240 KB).
Related articles
External links
Friedrich Huebler, 27 April 2008 (edited 14 August 2011), Creative Commons License
Permanent URL: http://huebler.blogspot.com/2008/04/stata.html
Sunday, April 13, 2008

Reported and tested literacy in Nigeria

Household surveys like the Demographic and Health Surveys (DHS) or the Multiple Indicator Cluster Surveys (MICS) collect data on literacy with various methods. One approach is to simply ask respondents whether they can read and write. In an alternative approach, the reading ability is tested by asking respondents to read a sentence from a card. More detailed assessments of literacy, such as the National Assessment of Adult Literacy in the United States, require in-depth questionnaires that are beyond the scope of surveys like the DHS and MICS.

The Nigeria DHS of 2003 collected literacy data with two methods. First, the survey questionnaire contained the question: "Can (name) read and write in any language with understanding?" This question was asked for all household members aged 5 years and older, with two possible answers: yes or no (NPC and ORC Macro 2004: 247). The results of this literacy assessment were described in the article "Adult literacy in Nigeria", published on this site on 5 April 2008.

Second, a randomly selected subsample of women between 15 and 49 years and men between 15 and 59 years were asked to read a card with a simple sentence in their language. If the respondent could not read the whole sentence, the survey staff were asked to probe if the respondent could read any part of the sentence. The result was recorded as one of three options: (1) cannot read at all, (2) able to read only parts of sentence, or (3) able to read whole sentence. If no card in the respondents' language was available, or if the respondent was blind or visually impaired, the result was recorded in a separate category (NPC and ORC Macro 2004: 26-27).

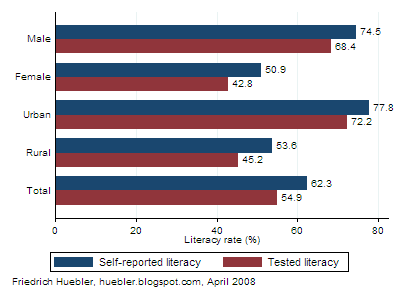
The graph and table below compare the data from the two literacy assessment methods - self-reporting and reading test - for the population aged 15 to 49 years. The self-reported literacy rate, the blue bars in the graph, is the share of respondents that claimed to be able to read and write. The tested literacy rate, the red bars in the graph, is the share of respondents that could read a complete sentence; household members who could only read parts of a sentence were counted as illiterate.

Self-reported and tested literacy in Nigeria, population 15-49 years
Bar graph with self-reported and tested literacy rates in Nigeria
Source: Nigeria Demographic and Health Survey 2003

A comparison of the self-reported and tested literacy rates in Nigeria shows that self-reporting tends to overestimate the degree of literacy in the population. 62 percent of men and women between 15 and 49 years were reported as able to "read and write in any language with understanding". However, the reading test revealed that only 55 percent could read a simple sentence. The difference of 7 percent can be explained by the fact that survey respondents are reluctant to admit that they themselves or other household members, on whose behalf they respond, are unable to read and write. This gap between self-reported and tested literacy can be observed across all groups of respondents: men, women, urban residents, and rural residents. The biggest difference exists in rural areas of Nigeria, were 54 percent of respondents claim to be literate but only 45 percent can in fact read.

Self-reported and tested literacy in Nigeria, population 15-49 years

Self-reported literacy rate (%) Tested literacy rate (%) Difference (%)
Male 74.5 68.4 6.1
Female 50.9 42.8 8.1
Urban 77.8 72.2 5.6
Rural 53.6 45.2 8.4
Total 62.3 54.9 7.4
Source: Nigeria Demographic and Health Survey 2003

References
  • National Population Commission (NPC) [Nigeria] and ORC Macro. 2004. Nigeria Demographic and Health Survey 2003. Calverton, Maryland: National Population Commission and ORC Macro. (Download report, PDF format, 4 MB)
Related articles External linksFriedrich Huebler, 13 April 2008, Creative Commons License
Permanent URL: http://huebler.blogspot.com/2008/04/self-reported-and-tested-literacy-in.html

Saturday, April 5, 2008

Adult literacy in Nigeria

The adult literacy rate is the share of literate persons in the population aged 15 years and older. In Nigeria, a Demographic and Health Survey (DHS) collected data on literacy that can be disaggregated by age, gender, area of residence, and other characteristics. In the survey, conducted in 2003, literacy is defined as the ability to "read and write in any language with understanding" (NPC and ORC Macro 2004: 247). To collect this data, respondents were only asked whether they are literate, but no reading or writing tests were applied. A smaller group of respondents, all women aged 15-49 years and one third of men aged 15-59 years, were asked to read a simple sentence in any of the major language groups of Nigeria (NPC and ORC Macro 2004: 26-27). The literacy rates obtained from this separate reading test were not considered for the analysis that follows, but they are lower than the self-reported literacy rates that cover all survey respondents aged 5 years and older. A separate article on this site describes the difference between self-reported and tested literacy in Nigeria in more detail.

In Nigeria, 55% of the population aged 15 years and older can read and write according to the findings of the DHS. More men (67%) than women (44%) are literate, and the literacy rate is higher in urban (71%) than in rural areas (47%).

Adult literacy rate in Nigeria, 2003
Category
Literacy rate (%)
Male 67.3
Female 43.7
Urban 70.9
Rural 46.8
Total 55.3
Source: Nigeria Demographic and Health Survey 2003

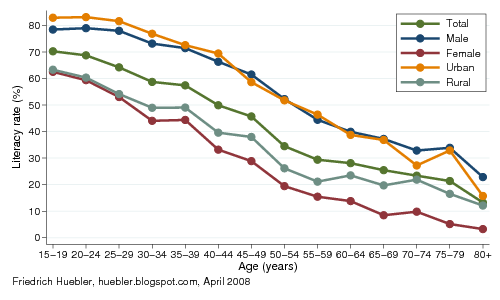
Although almost half of all adult Nigerians cannot read and write, analysis of the survey data by age reveals a steady increase in literacy over the years. Today, more children go to school and learn to read and write than in previous decades. As a result, younger persons are much more likely to be literate than older persons. For the graph below, the survey respondents were divided into 5-year age groups. Among persons aged 15 to 19 years - those who were of primary school age in the 1990s - the literacy rate is 70%. Among persons 80 years or older, only 13% are literate.

A similar rate of increase in the literacy rate can be observed for men, women, urban residents, and rural residents. Among women 80 years or older, only 3% can read and write, compared to 23% of all men in the same age group. Among 15- to 19-year-olds, the female literacy rate is 63% and the male literacy rate 79%. While literacy rates have increased steadily for men and women, there continues to be a large gender gap. A similar gap exists between residents of urban and rural areas.

Adult literacy rate in Nigeria by age, gender and area of residence, 2003
Graph with literacy rates by age, gender and area of residence, Nigeria 2003
Source: Nigeria Demographic and Health Survey 2003

References
  • National Population Commission (NPC) [Nigeria] and ORC Macro. 2004. Nigeria Demographic and Health Survey 2003. Calverton, Maryland: National Population Commission and ORC Macro. (Download report, PDF format, 4 MB)
Related articles

External links

Friedrich Huebler, 5 April 2008 (edited 13 April 2008), Creative Commons License
Permanent URL: http://huebler.blogspot.com/2008/04/adult-literacy-in-nigeria.html

Wednesday, March 12, 2008

Regional distribution of children out of school

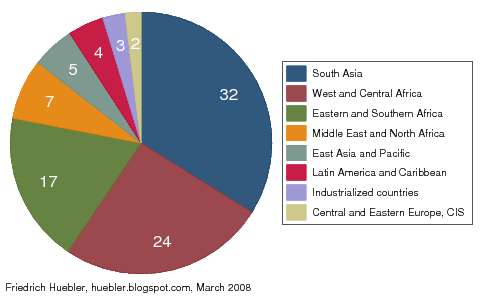
UNICEF estimates that 93 million children of primary school age were out of school in 2006. The graph below presents the regional distribution of these children according to the country classification used by UNICEF. The majority of children out of school, 41 million, lived in Sub-Saharan Africa, the region with the world's lowest primary school enrollment rates. In South Asia, 32 million children were out of school, most of them in India, the country with the world's largest population of children not in school.

In other regions, fewer children of primary school age were not in school. The Middle East and North Africa, East Asia and the Pacific, Latin America and the Caribbean, the industrialized countries, and the countries of Central and Eastern Europe and the Commonwealth of Independent States (CIS) combined account for 20 million children out of school, only one fifth of the global number.

Estimates for individual countries are available on the Childinfo website of UNICEF. The site also describes the data sources and methodology for UNICEF's calculation of the number of children out of school.

Regional distribution of children of primary school age out of school (in millions), 2006
Pie chart with the regional distribution of children out of primary school in 2006
Source: UNICEF, 2007, Progress for Children.

References
  • United Nations Children's Fund (UNICEF). 2007. Progress for children: A World Fit for Children statistical review. New York: UNICEF. (Download PDF, 3.6 MB)
Related articles

External links

Friedrich Huebler, 12 March 2008 (edited 8 February 2009), Creative Commons License
Permanent URL: http://huebler.blogspot.com/2008/03/regional-distribution-of-children-out.html

Monday, March 3, 2008

Global population of primary school age, 2000-2015

The second UN Millennium Development Goal (MDG) is the achievement of universal primary education by the year 2015. Since 2000, many countries have come closer to this goal, but at the current rate of progress it is likely that the goal will be missed when the year 2015 arrives.

To ensure that all children attend and complete primary school, countries have to provide enough schools, teachers, and training materials. Future demographic trends are one factor that has to be taken into consideration to plan for the education system. The UN Population Division provides population projections that can be combined with data on national primary school ages from the UNESCO Institute for Statistics to calculate national and regional trends in the population of primary school age.

The graph and table below depict the population trends by MDG region. At the global level, the number of children of primary school age is projected to increase from 655 million in 2000 to 668 million in 2015. In some regions, the population of primary school age is expected to shrink, while other regions experience a population increase.

Population of primary school age, 2000-2015
Graph with population of primary school age from 2000 to 2015
Data sources: (1) Population: UN Population Division, World Population Prospects 2006. (2) Primary school ages: UNESCO Institute for Statistics, Data Centre.

Two regions with very different trends stand out. In Sub-Saharan Africa, the number of children of primary school age is estimated to grow by 37 percent or 41 million children over the period 2000 to 2015. Countries in this region not only have to provide schools and teachers for all children that have been born so far, they have to increase the capacity of the education system further to accommodate the rapidly growing population. Even wealthy countries with a well-developed education infrastructure would struggle if they had to expand the capacity of their education system by more than one third over a period of 15 years.

In contrast, the population of primary school age in Eastern Asia is expected to drop by 25 percent or 29 million between 2000 and 2015, easing the pressure on the education system. Other regions with a projected decrease in the population of primary school age are the Commonwealth of Independent States and the developed countries. In Latin America and the Caribbean and in South-Eastern Asia, the population is expected to be virtually unchanged.

In Western Asia, Southern Asia, Oceania, and Northern Africa, the projections also show an increase in the population of primary school age, but at a lower relative and absolute level than Sub-Saharan Africa. Countries in the former regions therefore face fewer demographic obstacles on the path to universal primary education than countries in Sub-Saharan Africa.

Population of primary school age, 2000-2015
Region Population of primary school age (million) Change 2000-2015
2000 2015 Million Percent
Oceania 1.1 1.3 0.2 22.8
Commonwealth of Independent States 15.1 12.3 -2.9 -19.0
Northern Africa 19.7 20.0 0.3 1.8
Western Asia 23.9 27.2 3.2 13.5
Latin America and the Caribbean 58.1 57.7 -0.4 -0.7
South-Eastern Asia 63.4 62.9 -0.5 -0.8
Developed countries 67.8 65.0 -2.8 -4.2
Sub-Saharan Africa 111.4 152.5 41.1 36.9
Eastern Asia 117.3 88.2 -29.1 -24.8
Southern Asia 177.0 181.2 4.2 2.4
World 654.9 668.3 13.4 2.0
Data sources: (1) Population: UN Population Division, World Population Prospects 2006. (2) Primary school ages: UNESCO Institute for Statistics, Data Centre.

References
External links
Related articles
Friedrich Huebler, 3 March 2008 (edited 8 February 2009), Creative Commons License
Permanent URL: http://huebler.blogspot.com/2008/03/global-population-of-primary-school-age.html