Monday, February 11, 2008

Survival rate to the last grade of primary school

Since January 2008, the survival rate to the last grade of primary school is an official indicator to track progress toward the second UN Millennium Development Goal (MDG), which calls for universal primary education by the year 2015. The survival rate to the last grade is the percentage of a cohort of students who enter the first grade of primary education and who are expected to reach the last grade, regardless of repetition.

As an example, assume that primary school has four grades. Assume further that 100 children enter grade one and that 5 of these children drop out from school before they reach the last grade. The remaining 95 children reach grade four, with or without repeating one or more grades. In this case, the survival rate to the last grade is 95 / 100 = 95%.

As a previous article on this site explains, the survival rate to grade five was used an official indicator for MDG 2 until 2007. The survival rate to the last grade is a better indicator because it can be calculated for countries with fewer than five grades of primary school and because it is more in line with the goal of universal primary education.

The map below shows the most recent statistics on the survival rate to the last grade from the UNESCO Institute for Statistics (UIS). In most cases, the statistics are from the year 2005. The next revision of the UIS database, expected in mid-2008, will contain survival rates for 2006.

Survival rate to the last grade of primary school, 2005
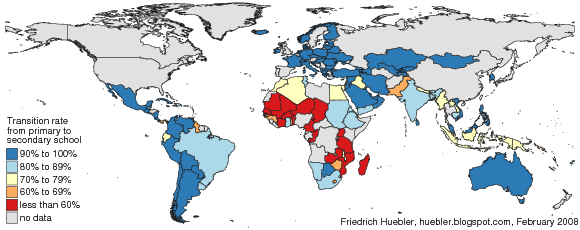
Map of the world showing national survival rates to the last grade of primary school, 2005
Data source: UNESCO Institute for Statistics, Data Centre, January 2008.

The current UIS database lists the survival rate to the last grade for 154 countries. The values range from 25% in Nauru and Uganda to 100% in Croatia, Cyprus, Iceland, Israel, Italy, Norway, Spain, and Tajikistan. In addition to Nauru and Uganda, nine other countries have survival rates below 50%: Chad (26%), Rwanda (31%), Equatorial Guinea (33%), Malawi (34%), Mauritania (39%), Madagascar (43%), Turks and Caicos Islands (45%), and Benin and Mozambique (46%). In these eleven countries, more than half of all children who start attending primary school drop out before they reach the last grade.

Ten countries have survival rates in the range 50-60%, 20 each are in the range 60-70% and 70-80%, 26 countries have survival rates from 80% to 90%, and in 67 countries 90% or more of all primary school entrants reach the last grade. As the map shows, almost all countries with survival rates below 60% are located in Sub-Saharan Africa.

The following table compares average survival rates in the different MDG regions. In the group of developed countries, in the countries from the Commonwealth of Independent States (former Soviet Republics), and in Eastern Asia, almost all children reach the last grade of primary school. In contrast, fewer than two thirds of all first grade students in Sub-Saharan Africa reach the last grade. Survival rates are also relatively low in Northern Africa and Oceania (78%), and in Southern and South-Eastern Asia (84%). In Western Asia and Latin America, around 90% of all first grade students reach the last grade.

Survival rate to the last grade of primary school, 2005
MDG region Survival rate to last grade (%)
Male FemaleTotal
Developed countries 99.199.299.2
Commonwealth of Independent States99.699.099.4
Eastern Asia98.998.898.8
South-Eastern Asia84.584.384.4
Oceania78.478.278.3
Southern Asia84.583.083.8
Western Asia88.786.988.0
Northern Africa75.381.878.3
Sub-Saharan Africa64.363.163.9
Latin America and the Caribbean90.590.190.4
World85.184.584.9
Data source: UNESCO Institute for Statistics, Data Centre, January 2008.

The average survival rate to the last grade at the global level is 85%, with virtually no difference between boys and girls. However, gender disparities exist in some regions, in particular in Northern Africa, were girls, with an average survival rate of 82%, are more likely to continue their education to the last grade of primary school than boys, whose survival rate is 75%.

Related articles
External links
Friedrich Huebler, 11 February 2008, Creative Commons License
Permanent URL: http://huebler.blogspot.com/2008/02/survival-rate-to-last-grade-of-primary.html

Monday, February 4, 2008

Official MDG targets and indicators

Progress toward the UN Millennium Development Goals is monitored with an official list of MDG indicators. These indicators are endorsed by the Inter-Agency and Expert Group (IAEG) on MDG Indicators, whose work is coordinated by the United Nations Statistics Division. At its last meeting in November 2007, the IAEG agreed on a revised set of MDG indicators that will be used for the next global assessment of progress in 2008. In the area of education, the following goals and indicators are now in effect.

Millennium Development Goals and indicators related to education
Goals and targets Indicators for monitoring progress
Goal 2: Achieve universal primary education
Target 2.A: Ensure that, by 2015, children everywhere, boys and girls alike, will be able to complete a full course of primary schooling. 2.1 Net enrolment ratio in primary education.
2.2 Proportion of pupils starting grade 1 who reach last grade of primary.
2.3 Literacy rate of 15-24 year-olds, women and men.
Goal 3: Promote gender equality and empower women
Target 3.A: Eliminate gender disparity in primary and secondary education, preferably by 2005, and in all levels of education no later than 2015. 3.1 Ratios of girls to boys in primary, secondary and tertiary education.
Goal 6: Combat HIV/AIDS, malaria and other diseases
Target 6.A: Have halted by 2015 and begun to reverse the spread of
HIV/AIDS.
6.4 Ratio of school attendance of orphans to school attendance of non-orphans aged 10-14 years.

Most of these indicators are unchanged, with one exception. The survival rate to the last grade of primary school (indicator 2.2) replaces the survival rate to grade 5 of primary school that was previously used as one of the indicators for MDG 2, universal primary education by 2015. The survival rate to the last grade is a better indicator for this goal than the survival rate to grade 5. First, the survival rate to grade 5 is not relevant in countries where primary school has only four grades and for such countries the UNESCO Institute for Statistics does not provide estimates for this indicator. Second, the survival rate to grade 5 offers no information on continued school attendance in countries where primary school has more than five grades. Estimates of the survival rate to grade 5 can therefore provide an incomplete picture of progress toward universal primary education. In contrast, the survival rate to the last grade can be used in all countries, regardless of the official duration of primary school.

The complete list of indicators is available at the official UN site for the MDG indicators.

External links
Related articles
Friedrich Huebler, 4 February 2008 (edited 17 October 2008), Creative Commons License
Permanent URL: http://huebler.blogspot.com/2008/02/official-mdg-targets-and-indicators.html

Sunday, January 27, 2008

The State of the World's Children 2008 by UNICEF

Cover of The State of the World's Children 2008 by UNICEFUNICEF released the 2008 edition of its annual publication The State of the World's Children on 22 January 2008. This year's report is dedicated to child survival and primary health care for children and their mothers.
In 2006, 9.7 million children died before they reached their fifth birthday. In spite of improvements in the area of child survival, the world is not on track to reach the Millennium Development Goal of reducing the rate of child mortality by two thirds between 1990 and 2015.

The State of the World's Children contains statistical tables with national data on nutrition, health, HIV and AIDS, education, demography, economy, women, and child protection. In the area of education, the report lists data for the following indicators:
  • Primary school enrollment and attendance
  • Secondary school enrollment and attendance
  • Survival rate to grade 5
  • Youth and adult literacy
The tables in The State of the World's Children complement the statistical review Progress for Children that was released by UNICEF in December 2007.

External links
Related articles
Friedrich Huebler, 27 January 2008 (edited 1 February 2009), Creative Commons License
Permanent URL: http://huebler.blogspot.com/2008/01/state-of-worlds-children-2008-by-unicef.html

Sunday, January 20, 2008

Secondary school attendance in India in 2006

In India, 83 percent of all children of primary school age (6-10 years) attend primary school, as described in a previous article on this site. Primary school net attendance rates (NAR) are highest in urban areas and among children from the richest households.

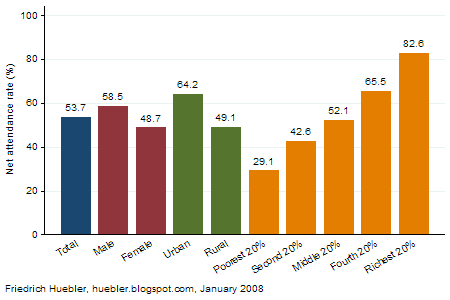
Fewer children continue their education at the secondary level. Data from a nationally representative Demographic and Health Survey (called National Family Health Survey in India) conducted in 2005 and 2006 shows that only 54 percent of all children of secondary school age (11-17 years) attend secondary school. In addition, there are large disparities between different groups of children, as the graph below demonstrates. Boys and children from urban areas are more likely to be in secondary school than girls and children from rural areas.

Secondary school net attendance rate (NAR), India 2006
Bar graph showing secondary school net attendance rate in India in 2006
Data source: India Demographic and Health Survey 2005-06.

The biggest disparities exist between children from different wealth quintiles. Among children from the richest 20 percent of all households, the secondary NAR is 83 percent, compared to a secondary NAR of only 29 percent among children from the poorest households. The respective primary NAR values are 96 percent for children from the richest quintile and 69 percent for children from the poorest quintile. Children from poor households are not only less likely to enter school than children from wealthier households, they are also far less likely to continue their education after four years of primary school.

References
  • International Institute for Population Sciences (IIPS), and Macro International. 2007a. National Family Health Survey (NFHS-3) 2005-06, India: Volume 1. Mumbai: IIPS. (Download in PDF format, 7.9 MB)
  • International Institute for Population Sciences (IIPS), and Macro International. 2007b. National Family Health Survey (NFHS-3) 2005-06, India: Volume II. Mumbai: IIPS. (Download in PDF format, 4.1 MB)
Related articles
External links
Friedrich Huebler, 20 January 2008 (edited 12 October 2008), Creative Commons License
Permanent URL: http://huebler.blogspot.com/2008/01/secondary-school-attendance-in-india-in.html

Sunday, January 13, 2008

Universal primary education by 2015: A goal out of reach?

The new UNICEF publication Progress for Children compares data on children out of school by UNESCO and UNICEF. According to UNESCO, 72 million children of primary school age were out of school in 2005, down from 96 million in 1999. UNICEF estimates that 93 million children were out of school in 2005/2006, down from 115 million in 2002. Although both sets of data show a decline in the number of children out of school, they also indicate that the Millennium Development Goal of universal primary education by 2015 may be out of reach.

The graph below plots trend data on the number of children out of school calculated by UNESCO for the period 1999-2005 and by UNICEF for the period 2002-2006. (The 2002 estimate in the latter trend line is based on joint work by UNICEF and the UNESCO Institute for Statistics.) If we assume that the reduction in the number of children out of school continues at the same average rate as over the past years, more than 30 to 40 million children will still be out of school by 2015 and the international community will have failed in its efforts to secure primary education for all children.

Children out of school, 1999-2015
Graph with trend data on number of children out of school, 1999-2015
Data sources: UIS (2005), UNESCO (2007), UNICEF (2007).

References
  • UNESCO Institute for Statistics (UIS). 2005. Children out of school: Measuring exclusion from primary education. Montreal: UIS. (Download in PDF format, 4.9 MB)
  • UNESCO. 2007. Education for all by 2015: Will we make it? - EFA global monitoring report 2008. Paris: UNESCO. (Download in PDF format, 11.8 MB)
  • UNICEF. 2007. Progress for Children: A World Fit for Children Statistical Review. New York: UNICEF. (Download in PDF format, 3.6 MB)
Related articles
External links
Friedrich Huebler, 13 January 2008 (edited 8 February 2009), Creative Commons License
Permanent URL: http://huebler.blogspot.com/2008/01/universal-primary-education-by-2015.html

Saturday, December 15, 2007

UNICEF statistical review: Progress for Children

Cover of "Progress for Children: A World Fit for Children Statistical Review" by UNICEFOn 10 December 2007, UNICEF launched a new publication, Progress for Children: A World Fit for Children Statistical Review. With more than 60 pages of graphs and tables, the report draws a detailed statistical picture of the current state of the world's children. The publication is divided into sections organized by Millennium Development Goal.
  • MDG 1: Eradicate extreme poverty and hunger
  • MDG 2: Achieve universal primary education
  • MDG 3: Promote gender equality and empower women
  • MDG 4: Reduce child mortality
  • MDG 5: Improve maternal health
  • MDG 6: Combat HIV and AIDS, malaria and other diseases
  • MDG 7: Ensure environmental sustainability
An additional section has data on protection against abuse, exploitation, and violence.

Some findings of the report in the area of education are:
  • The number of children out of school has fallen from 115 million in 2002 to 93 million in 2005-2006.
  • More than three quarters of all children out of school worldwide live in Sub-Saharan Africa and South Asia.
  • Secondary school net attendance or enrollment rates are below 50 percent in many countries, including most of Africa.
  • Almost all countries in North and South America, Europe, Central Asia, and East Asia have reached the goal of gender parity in primary education.
  • Few countries have reached gender parity in secondary education.
  • Child labor, which interferes with education, is most prevalent in Sub-Saharan Africa.
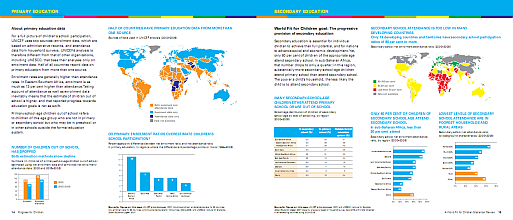
Excerpt from Progress for Children: Data on primary and secondary education
Excerpt from "Progress for Children" by UNICEF: data on primary and secondary education
Source: UNICEF 2007: p. 14-15.

References
  • UNICEF. 2007. Progress for Children: A World Fit for Children Statistical Review. New York: UNICEF. (Download in PDF format, 3.6 MB)
Related articles
External links
Friedrich Huebler, 15 December 2007, Creative Commons License
Permanent URL: http://huebler.blogspot.com/2007/12/unicef-statistical-review-progress-for.html

Sunday, December 9, 2007

Primary school attendance by state in India

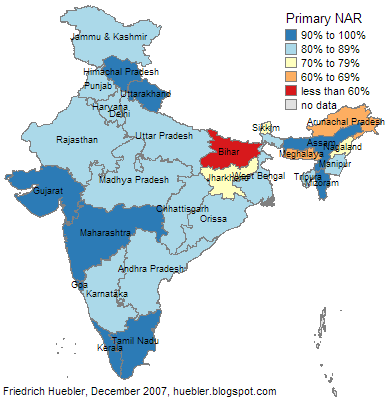
The average primary school net attendance rate in India is 83 percent according to data from a Demographic and Health Survey (DHS) conducted in 2005 and 2006. However, the national average hides considerable regional variation in primary school attendance. India is divided into 28 states and 7 union territories. With the DHS data it is possible to calculate the primary school NAR in 29 states and territories, shown in the map and table below.

Primary school attendance in India by state and territory, 2006
Map showing primary school attendance in India by state and territory, 2006
Data source: India DHS 2005-06

The states with the highest primary school net attendance rates, between 98 and 99 percent, are Himachal Pradesh, Kerala, and Tamil Nadu. In these states, virtually all children of primary school age are in school. Six other states also have primary NAR values above 90 percent: Assam, Goa, Gujarat, Maharashtra, Mizoram, and Uttarakhand. In fifteen states and territories the primary NAR is between 80 and 90 percent.

In six states, fewer than four out of five children of primary school age are in school: Arunachal Pradesh, Bihar, Jharkhand, Meghalaya, Nagaland, and Sikkim. By far the lowest primary school attendance rates are observed in Bihar (59 percent) and Meghalaya (60 percent), two of the poorest and economically least developed states of India.

Primary school attendance in India by state and territory, 2006
State or Territory Primary NAR (%) State or Territory Primary NAR (%)
Andaman and Nicobar Islands - Lakshadweep -
Andhra Pradesh 89.2 Madhya Pradesh 81.0
Arunachal Pradesh 67.3 Maharashtra 91.7
Assam 91.1 Manipur 80.3
Bihar 58.5 Meghalaya 60.4
Chandigarh - Mizoram 91.8
Chhattisgarh 86.5 Nagaland 71.9
Dadra and Nagar Haveli - Orissa 86.8
Daman and Diu - Puducherry -
Delhi 89.9 Punjab 89.1
Goa 94.1 Rajasthan 81.0
Gujarat 91.1 Sikkim 77.6
Haryana 87.6 Tamil Nadu 98.5
Himachal Pradesh 97.8 Tripura 89.6
Jammu and Kashmir 86.7 Uttar Pradesh 81.4
Jharkhand 72.1 Uttarakhand 93.4
Karnataka 88.5 West Bengal 85.1
Kerala 98.1 India 83.3
Data source: India DHS 2005-06

Related articles
External links
Friedrich Huebler, 9 December 2007 (edited 12 October 2008), Creative Commons License
Permanent URL: http://huebler.blogspot.com/2007/12/primary-school-attendance-by-state-in.html