Monday, December 3, 2007

EFA Global Monitoring Report 2008

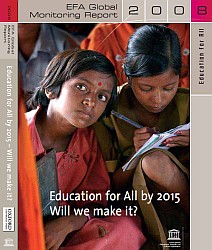
Cover of the Education for All Global Monitoring Report 2008 by UNESCOOn 29 November 2007, UNESCO released the 2008 edition of the annual Education for All Global Monitoring Report, with the title Education for All by 2015: Will we make it? The report, now in its sixth edition, monitors progress towards the six Education for All goals adopted at the World Education Forum in Dakar, Senegal in 2000:
  1. Expand and improve early childhood care and education.
  2. Provide free and compulsory universal primary education by 2015.
  3. Equitable access to learning and life-skills programs.
  4. Achieve a 50% improvement in adult literacy rates.
  5. Eliminate gender disparities in primary and secondary education by 2005 and at all levels by 2015.
  6. Improve all aspects of the quality of education.
Some highlights of the 2008 report are:
  • Between 1999 and 2005, primary school enrollment rose from 647 million to 688 million worldwide. The rate of increase was particularly high in Sub-Saharan Africa and in South and West Asia. As a result, the global number of children out of school fell from 96 million in 1999 to 72 million in 2005.
  • Projections based on current trends show that more than 50 countries will not achieve universal primary education by 2015.
  • One third of all countries missed the goal of gender parity in primary education by 2005. Two thirds of all countries missed the goal of gender parity in secondary education. According to projections, more than 90 countries will not reach gender parity in primary and secondary education by 2015.
  • Fourteen countries abolished primary school fees since 2000 but the cost of schooling remains an obstacle for millions of children.
  • The emphasis by the international community on primary education has come at the expense of early childhood education and literacy programs for youth and adults.
  • One in five adults lacks basic literacy skills. Women account for two thirds of all illiterate adults worldwide. Three quarters of all countries for which projections were calculated will miss the goal of halving adult illiteracy rates by 2015.
The EFA Global Monitoring Report offers a great amount of data and statistical analysis. An annex contains more than 140 pages of statistical tables with national, regional and global data up to the year 2005.

References
  • UNESCO. 2007. Education for all by 2015: Will we make it? - EFA global monitoring report 2008. Paris: UNESCO. (Download in PDF format, 11.8 MB)
Related articles
External links
Friedrich Huebler, 3 December 2007 (edited 8 December 2008), Creative Commons License
Permanent URL: http://huebler.blogspot.com/2007/12/efa-global-monitoring-report-2008.html

Monday, November 19, 2007

Primary school attendance in India in 2006

21 million children of primary school age in India were out of school in 2006, more than in any other country. Compared to 2000, the number of children out of school has fallen by 9 million, but the Millennium Development Goal of universal primary education by 2015 can only be met if the increase in primary school attendance accelerates in the coming years.

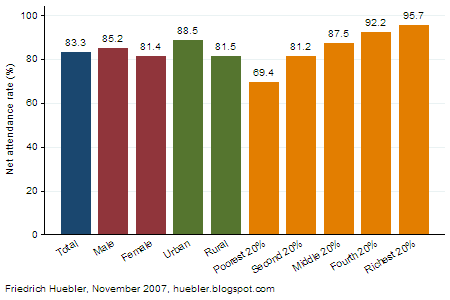
According to data from a nationally representative Demographic and Health Survey (DHS), the primary school net attendance rate (NAR) in India was 83 percent in 2006. (In India, the DHS is referred to as National Family Health Survey or NFHS.) In other words, more than 8 out of 10 children of primary school age (6-10 years in India) were attending primary school. In 2000, the primary school net attendance rate was 76 percent. Although the attendance rate has increased, there are persistent disparities in the education system of India. The bar graph below displays the primary school NAR by sex, area of residence, and household wealth. 85 percent of all boys and 81 percent of all girls are in school and the country is therefore close to gender parity. On the other hand, there is a larger gap between urban and rural areas. The urban primary NAR is 89 percent and the rural NAR is 82 percent.

Primary school net attendance rate (NAR), India 2006
Bar graph showing primary school net attendance rate in India in 2006
Data source: India Demographic and Health Survey 2005-06

Disaggregation by household wealth reveals even greater disparities. 96 percent of all primary-school-age children from the richest household quintile are in school. With declining household wealth, the share of children in school also falls. In the poorest household quintile, the primary NAR is only 69 percent, almost one third below the NAR in the richest households. As a consequence, children from the poorest households make up almost half of all children out of school in India. An earlier article on this site contains additional data on children out of school in India.

Note on NAR calculation

The official report for the India DHS lists the primary NAR as 71.9 percent (IIPS and Macro International 2007a, Table 2.8, page 31). The primary NAR cited above, 83.3 percent, is higher because of a different calculation method. The DHS report uses the traditional definition of the primary school net attendance rate, which only considers attendance in primary school and ignores attendance at higher levels of education.
  • Primary NAR (traditional definition) = Number of children of primary school age in primary school / Total number of children of primary school age
A joint report by UNESCO and UNICEF, Children out of school: Measuring exclusion from primary education (UNESCO Institute for Statistics 2005), introduced a revised method to calculate the primary NAR. In contrast to the traditional calculation method, school attendance at primary or higher levels of education is considered.
  • Primary NAR (revised definition) = Number of children of primary school age in primary school or higher / Total number of children of primary school age
In countries like India, where a relatively large number of children of primary school age are already in secondary school, the traditional calculation method underestimates the true level of participation in the education system and overestimates the number of children out of school. During an assessment of progress toward universal primary education, the primary NAR published in the final DHS report would lead to the wrong conclusion that almost 30 percent of all children of primary school age are not in school in India. In fact, fewer than 17 percent of all children of primary school age are not in school.

References
  • International Institute for Population Sciences (IIPS), and Macro International. 2007a. National Family Health Survey (NFHS-3) 2005-06, India: Volume 1. Mumbai: IIPS. (Download in PDF format, 7.9 MB)
  • International Institute for Population Sciences (IIPS), and Macro International. 2007b. National Family Health Survey (NFHS-3) 2005-06, India: Volume II. Mumbai: IIPS. (Download in PDF format, 4.1 MB)
  • UNESCO Institute for Statistics (UIS). 2005. Children out of school: Measuring exclusion from primary education. Montreal: UIS. (Download in PDF format, 4.9 MB)
Related articles
External links
Friedrich Huebler, 19 November 2007 (edited 12 October 2008), Creative Commons License
Permanent URL: http://huebler.blogspot.com/2007/11/primary-school-attendance-in-india-in.html

Tuesday, November 13, 2007

India has 21 million children out of school

India is the country with the largest number of children out of school. India has more children of school age than China and at the same time relatively low attendance rates, in spite of recent increases in primary and secondary school participation.

Newly released data from a Demographic and Health Survey (DHS) show that the primary school attendance rate has increased by more than one percentage point annually since the beginning of the decade. In 2000, 76 percent of all children of primary school age (6-10 years) were in school. By 2006, this value had increased to 83 percent (see Table 1). The attendance rate of girls increased by 9 percent over the 2000-2006 period and the attendance rate of boys by 6 percent. School attendance rates also grew in urban and rural areas, and across all household wealth quintiles. However, close to 17 percent of all children of primary school age continue to be out of school.

Table 1: Children of primary school age in school (percent), India 2000 and 2006

2000 2006 Change 2000 to 2006
Male 79.2 85.2 5.9
Female 72.3 81.4 9.1
Urban 82.5 88.5 5.9
Rural 73.8 81.5 7.7
Poorest 20% 66.1 69.4 3.2
Second 20% 69.2 81.2 12.1
Middle 20% 78.8 87.5 8.7
Fourth 20% 82.1 92.2 10.1
Richest 20% 89.1 95.7 6.6
Total 75.9 83.3 7.5
Data sources: India Multiple Indicator Cluster Survey (MICS) 2000, India DHS 2005-06.

As a result of the increase in primary school attendance, the number of children out of school fell by almost one third from 30 million in 2000 to 21 million in 2006 (see Table 2). This pattern could be observed for boys and girls, and for residents of urban and rural areas. However, disaggregation by household wealth reveals that one group of children did not follow the nationwide trend. Among the poorest 20 percent of all households, the number of children out of school grew from 9.4 million in 2000 to 9.8 million in 2006. Although the primary school net attendance rate among children from the poorest households grew by 3 percentage points from 2000 to 2006 (see Table 1), this increase was not strong enough to keep pace with population growth in the poorest segment of the Indian population.

Table 2: Children of primary school age out of school (million), India 2000 and 2006

2000 2006 Change 2000 to 2006
Male 13.0 9.5 -3.5
Female 16.4 11.2 -5.2
Urban 5.0 3.7 -1.3
Rural 24.5 17.0 -7.5
Poorest 20% 9.4 9.8 0.5
Second 20% 8.5 5.3 -3.2
Middle 20% 5.2 3.1 -2.1
Fourth 20% 4.3 1.7 -2.6
Richest 20% 2.0 0.8 -1.3
Total 29.5 20.7 -8.7
Data sources: India MICS 2000, India DHS 2005-06.

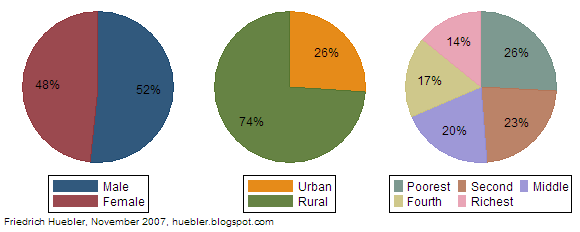
A comparison of the composition of the total population of primary school age and the population of children out of school shows which group of children are disproportionately more likely to miss out on education. Figure 1 shows the composition of the Indian population aged 6 to 10 years. 52 percent of all children in this age group are boys and 48 percent are girls. About one quarter of all children of primary school age live in urban areas and the remaining three quarters in rural areas.

Wealth quintiles are constructed by ranking the entire population of India, regardless of age, according to household wealth and dividing them into five equally sized groups with 20 percent each of the total population. As Figure 1 shows, households from poorer quintiles are more likely to have children than households from richer quintiles. Overall, 26 percent of all children between 6 and 10 years live in the bottom quintile and a further 23 percent in the second quintile.

Figure 1: Population of primary school age by sex, area of residence, and wealth quintile, India 2006
Pie charts showing composition of population of primary school age, India 2006
Data source: India Demographic and Health Survey 2005-06.

Figure 2: Children of primary school age out of school by sex, area of residence, and wealth quintile, India 2006
Pie charts showing composition of group of children of primary school age out of school, India 2006
Data source: India Demographic and Health Survey 2005-06.

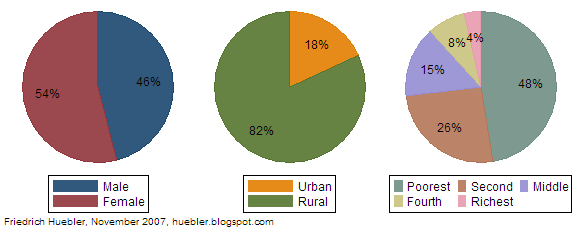
Figure 2 shows the composition of the group of children aged 6 to 10 years that are out of school. Although girls only account for 48 percent of the total number of children in this age group, they make up 54 percent of the children out of school. Rural children are disproportionately more likely to be out of school than urban children. Most strikingly, children from the poorest quintile make up almost half of all children out of school. 48 percent - 10 million of the 21 million children out of school - live in the poorest quintile. 74 percent of all children out of school live in the two poorest quintiles.

These numbers emphasize the close link between poverty and school attendance in India. School attendance rates have increased among the poorest households between 2000 and 2006 but the increase was not large enough to keep pace with population growth. Unless India places more emphasis on school attendance among the poor, the country will miss the Millennium Development Goal of universal primary education by 2015.

Related articles
External links
Friedrich Huebler, 13 November 2007 (edited 12 October 2008), Creative Commons License
Permanent URL: http://huebler.blogspot.com/2007/11/india-has-21-million-children-out-of.html

Monday, October 22, 2007

Global Education Digest 2007

Cover of the Global Education Digest 2007 by UNESCOThe UNESCO Institute for Statistics has released the Global Education Digest 2007: Comparing Education Statistics Across the World. The Global Education Digest is an annual publication that presents the latest statistics on primary, secondary and tertiary education. The 2007 edition contains statistics from more than 200 countries up to the year 2005.

The focus of this year's Global Education Digest is the financing of education. The report draws attention to the fact that public spending on education is concentrated in developed countries. The United States alone accounts for more than one quarter of the global education budget. Countries like France, Germany, Italy and the United Kingdom have education budgets that exceed the spending on education in all of Sub-Saharan Africa. Sub-Saharan Africa is home to 15 percent of the world's school-age population but combined spending on education by national governments in the region amounts to only 2.4 percent of the global education budget.

The world is at the midpoint between the adoption of the Millennium Development Goals and the 2015 target date, but without increased spending on education in Sub-Saharan Africa and other regions the goal of universal primary education is unlikely to be met.

External links
Related articles
Friedrich Huebler, 22 October 2007 (edited 28 December 2008), Creative Commons License
Permanent URL: http://huebler.blogspot.com/2007/10/global-education-digest-2007.html

Wednesday, September 26, 2007

Secondary school attendance in Nepal, 1996-2006

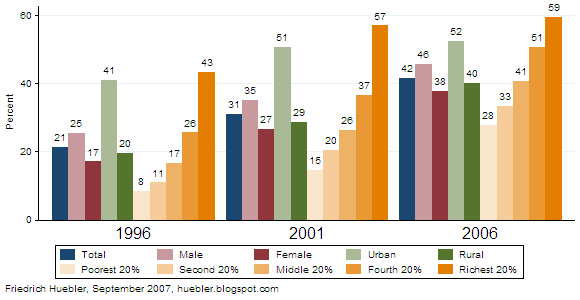
Over the past decade, the primary school net attendance rate (NAR) in Nepal increased from 65 percent in 1996 to 84 percent in 2006. At the secondary level of education, school attendance rates have also grown over the same period according to data from three Demographic and Health Surveys (DHS), shown in the graph and table below.

In 1996, only one in five children of secondary school age attended secondary school. By 2006, the secondary school NAR had doubled from 21 percent to 42 percent. The biggest relative increase was observed among the poorest households. In the poorest household quintile, the secondary school NAR more than tripled from 8 percent in 1996 to 28 percent in 2006. Most of this increase occurred over the period 2001 to 2006, when attendance rates in the richest households grew only marginally.

Secondary school net attendance rate (%), Nepal 1996-2006
Bar graph with trends in secondary school attendance in Nepal, 1996-2006
Data source: Nepal Demographic and Health Surveys, 1996, 2001, 2006.

The attendance rates of boys and girls grew by more than 20 percent between 1996 and 2006. The absolute gap between the two groups stayed the same, around 8 percent. The relative gap, measured by the gender parity index, the ratio of female to male attendance rate, improved from 0.67 to 0.83. The latest value is below the gender parity index in primary education, 0.95, but it brings the country closer to the Millennium Development Goal of gender parity in primary and secondary education.

Rural children managed to reduce the gap with urban children. In 1996, the secondary school NAR in urban areas was twice as high as in rural areas (41 versus 20 percent) but by 2006 the NAR in rural areas had doubled to 40 percent, while the NAR in urban areas grew to 52 percent.

Secondary school net attendance rate (%), Nepal 1996-2006

1996 2001 2006 Change 1996 to 2006
Total 21.3 30.9 41.7 20.4
Male 25.4 35.1 45.7 20.3
Female 17.1 26.6 37.8 20.8
Urban 40.9 50.6 52.4 11.5
Rural 19.5 28.7 40.1 20.5
Poorest 20% 8.4 14.6 27.8 19.4
Second 20% 10.9 20.5 33.3 22.4
Middle 20% 16.7 26.4 40.6 23.9
Fourth 20% 25.6 36.5 50.8 25.2
Richest 20% 43.3 57.0 59.5 16.1
Data source: Nepal Demographic and Health Surveys, 1996, 2001, 2006.

Related articles
External links
Friedrich Huebler, 26 September 2007 (edited 12 October 2008), Creative Commons License
Permanent URL: http://huebler.blogspot.com/2007/09/secondary-school-attendance-in-nepal.html

Tuesday, August 14, 2007

Primary school attendance in Nepal, 1996-2006

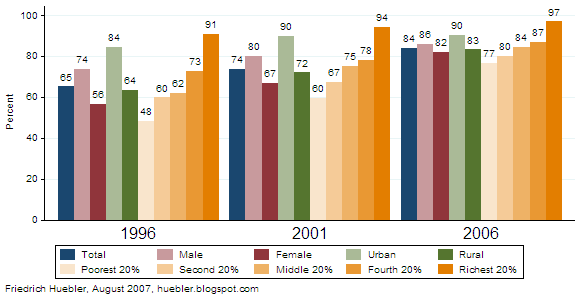
In 2006, a Demographic and Health Survey (DHS) collected data on school attendance in Nepal. A comparison with data from earlier DHS surveys, conducted in 1996 and 2001, shows a steady increase in primary school attendance over the last decade. The primary school net attendance rate (NAR) - the share of children of primary school age who attend primary school - has increased by almost 10 percentage points every five years, from 65 percent in 1996 to 84 percent in 2006. If Nepal can sustain this rate of increase it will reach the Millennium Development Goal of universal primary education by 2015.

The increase in attendance was accompanied by a reduction in disparities between boys and girls, residents of urban and rural areas, and children from different household wealth quintiles (see the graph and table below). Much of the increase in primary school attendance is due to higher attendance rates in rural areas, especially over the period 2001 to 2005, when attendance in urban areas grew only marginally.

Primary school net attendance rate (%), Nepal 1996-2006
Bar graph with trends in primary school attendance in Nepal, 1996-2006
Data source: Nepal Demographic and Health Surveys, 1996, 2001, 2006.

Children from the poorest 20 percent of all households saw the biggest increase in primary school attendance, from 48 percent in 1996 to 77 percent 2006. The difference in the primary NAR between children from the richest and poorest household quintiles fell by more than half over the same period, from 42 percent in 1996 to 20 percent in 2006.

Nepal also achieved a marked reduction in gender disparity over the past 10 years. In 1996, only 56 percent of all girls of primary school age attended primary school. This share grew to 82 percent by 2006. The primary NAR of boys grew from 74 percent to 86 percent over the same period. With a gender parity index (GPI) of 0.95 - the ratio of female to male NAR - Nepal has almost reached the Millennium Development Goal of gender parity in primary education.

Primary school net attendance rate (%), Nepal 1996-2006

199620012006Change 1996 to 2006
Total65.173.584.119.0
Male73.679.986.012.3
Female56.466.882.025.6
Urban84.389.890.25.9
Rural63.672.083.219.6
Poorest 20%48.459.676.728.3
Second 20%59.767.479.820.1
Middle 20%62.075.184.322.3
Fourth 20%72.678.286.914.3
Richest 20%90.694.396.96.2
Data source: Nepal Demographic and Health Surveys, 1996, 2001, 2006.

Comments on the 2006 DHS data

The authors of the final survey report from the 2006 DHS in Nepal counted children in school-based pre-primary centers as primary school students for the calculation of the primary school NAR. Children in informal, community based preschool classes were excluded from the calculation of the primary NAR. The author of this article chose the same approach.

A UNESCO country profile of Nepal prepared for the Education for All Global Monitoring Report 2007 explains that "there are significant differences in the way the school based and the community based [early childhood development centres] are running. Most of the school based centres are run by the DEO [District Education Office], and most of them are more primary schools than development centres."

The statement by UNESCO supports the treatment of children in school-based pre-primary centers in Nepal as equivalent to children in primary school for statistical purposes. In developing countries it is not uncommon to find children of primary school age in preschool but because of national differences the interpretation of the data from Nepal cannot necessarily be applied to other countries.

Related articles
External links
Friedrich Huebler, 14 August 2007 (edited 12 October 2008), Creative Commons License
Permanent URL: http://huebler.blogspot.com/2007/08/primary-school-attendance-in-nepal-1996.html

Sunday, August 5, 2007

Disparity between male and female literacy rates

Millennium Development Goal 3 calls for gender equality and the empowerment of women. One aspect of gender equality is literacy among men and women. In June 2007, the UNESCO Institute for Statistics (UIS) released new statistics on adult literacy and youth literacy. The adult literacy rate represents the population aged 15 years and older and the youth literacy rate the population aged 15 to 24 years. The most recent literacy data is from the year 2005.

Figure 1 compares the male and female literacy rates in 135 countries. The male literacy rate is plotted along the horizontal axis and the female literacy rate along the vertical axis. For each country, up to two points are drawn, one for adult literacy and one for youth literacy. The location of a country relative to the 45 degree line indicates whether more men or women are literate. If the literacy rate of men and women is the same, the country's marker is located on the 45 degree line. If the male literacy rate is higher than the female literacy rate, the marker is below the 45 degree line. In countries above the 45 degree line, a higher share of women is literate.

Figure 1: Male and female literacy rates
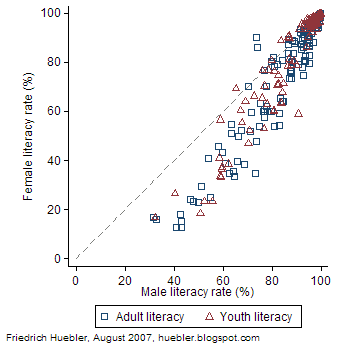
Scatter plot of male and female literacy rates by country
Source: UNESCO Institute for Statistics, Data Centre, June 2007.

The distribution of the points in Figure 1 shows clearly that in most countries the female literacy rate is below the male literacy rate. In Afghanistan, only 12.6 percent of all women over 15 years can read and write, compared to 43.1 percent of men. In Chad, the female literacy rate is 12.8 percent and the male literacy rate 40.8 percent. In four more countries, fewer than 20 percent of all women are literate: Niger (15.1 percent), Mali (15.9 percent), Burkina Faso (16.6 percent), and Guinea (18.1 percent). In 23 countries in total, less than half of the adult female population can read and write.

Male literacy rates are generally at a higher level but 8 countries have male adult literacy rates below 50 percent. In addition to Afghanistan and Chad, these countries are: Burkina Faso (male literacy rate 31.4 percent), Mali (32.7 percent), Guinea (42.6 percent), Niger (42.9 percent), Sierra Leone (46.7 percent), and Benin (47.9 percent).

Table 1 summarizes the literacy data from UNESCO. On average, the difference between male and female literacy rates is 12.8 percent among the adult population and 7.2 percent among the population aged 15 to 24 years. The smaller gender disparity among youth is due to trends in school attendance over the past years. Attendance has increased for both boys and girls but attendance rates have grown at a faster pace among girls.

Table 1: Male and female literacy rates
Adult or youth literacyCountries
with data
Male literacy
rate (%)
Female literacy
rate (%)
Difference male-female
literacy rate (%)
Adult literacy (15 years and older)13584.972.112.8
Youth literacy (15-24 years)13289.482.27.2
Source: UNESCO Institute for Statistics, Data Centre, June 2007. Average values are weighted by each country's adult and youth population.

In spite of the movement towards gender equality, large gaps remain. In four countries, the gap between male and female literacy among the adult population is greater than 30 percent: Yemen (male literacy rate 73.1 percent, female 34.7 percent, difference 38.4 percent), Central African Republic (male 64.8, female 33.5, difference 32.3), Afghanistan (male 43.1, female 12.6, difference 30.5), and Togo (male 68.7, female 38.5, difference 30.2). In 18 more countries, the male-female gap is between 20 and 30 percent. These countries are, in descending order of the size of the gap: Mozambique (difference male-female literacy rate 29.9 percent), Pakistan, Angola, Chad, Niger, Nepal, Ethiopia, Democratic Republic of the Congo, Morocco, India, Benin, Guinea, Egypt, Sierra Leone, Cote d'Ivoire, Senegal, Malawi, and Cambodia (difference 20.6 percent).

In a few countries, female literacy rates are above male literacy rates. In Lesotho, 90.3 percent of all women aged 15 years and older are literate, compared to 73.7 percent of all men (difference 16.6 percent). In Jamaica, the adult literacy rate is 85.9 percent among women and 74.1 percent among men (difference 11.8 percent). In four more countries, the literacy rate of women is between 3 and 1 percent above the male literacy rate: Malta, Philippines, Botswana, and Uruguay.

The youth literacy rate among the female population is more than 1 percentage point above the male literacy rate in 16 countries (listed in descending order of the gap): Nicaragua, Liberia, Honduras, El Salvador, Botswana, Malta, Philippines, Swaziland, Qatar, Dominican Republic, Namibia, Brazil, Venezuela, Mauritius, Mongolia, and Sri Lanka. The difference between female and male youth literacy rates in this group of countries ranges from 5.2 percent in Nicaragua to 1.1 percent in Sri Lanka.

In 15 countries, the male youth literacy rate is 20 or more percent above the female youth literacy rate. These countries are, in descending order of the literacy gap: Chad (difference male-female literacy rate 32.5 percent), Afghanistan, Yemen, Niger, Benin, Guinea, Ethiopia, Pakistan, Central African Republic, Mozambique, Sierra Leone, Angola, Nepal, Morocco, and Togo (difference 20.1 percent).

To download the latest national literacy rates, please visit the UIS Data Centre.

Related articles
External links
Friedrich Huebler, 5 August 2007 (edited 17 October 2008), Creative Commons License
Permanent URL: http://huebler.blogspot.com/2007/08/disparity-between-male-and-female.html