Wednesday, September 26, 2007

Secondary school attendance in Nepal, 1996-2006

Over the past decade, the primary school net attendance rate (NAR) in Nepal increased from 65 percent in 1996 to 84 percent in 2006. At the secondary level of education, school attendance rates have also grown over the same period according to data from three Demographic and Health Surveys (DHS), shown in the graph and table below.

In 1996, only one in five children of secondary school age attended secondary school. By 2006, the secondary school NAR had doubled from 21 percent to 42 percent. The biggest relative increase was observed among the poorest households. In the poorest household quintile, the secondary school NAR more than tripled from 8 percent in 1996 to 28 percent in 2006. Most of this increase occurred over the period 2001 to 2006, when attendance rates in the richest households grew only marginally.

Secondary school net attendance rate (%), Nepal 1996-2006
Bar graph with trends in secondary school attendance in Nepal, 1996-2006
Data source: Nepal Demographic and Health Surveys, 1996, 2001, 2006.

The attendance rates of boys and girls grew by more than 20 percent between 1996 and 2006. The absolute gap between the two groups stayed the same, around 8 percent. The relative gap, measured by the gender parity index, the ratio of female to male attendance rate, improved from 0.67 to 0.83. The latest value is below the gender parity index in primary education, 0.95, but it brings the country closer to the Millennium Development Goal of gender parity in primary and secondary education.

Rural children managed to reduce the gap with urban children. In 1996, the secondary school NAR in urban areas was twice as high as in rural areas (41 versus 20 percent) but by 2006 the NAR in rural areas had doubled to 40 percent, while the NAR in urban areas grew to 52 percent.

Secondary school net attendance rate (%), Nepal 1996-2006

1996 2001 2006 Change 1996 to 2006
Total 21.3 30.9 41.7 20.4
Male 25.4 35.1 45.7 20.3
Female 17.1 26.6 37.8 20.8
Urban 40.9 50.6 52.4 11.5
Rural 19.5 28.7 40.1 20.5
Poorest 20% 8.4 14.6 27.8 19.4
Second 20% 10.9 20.5 33.3 22.4
Middle 20% 16.7 26.4 40.6 23.9
Fourth 20% 25.6 36.5 50.8 25.2
Richest 20% 43.3 57.0 59.5 16.1
Data source: Nepal Demographic and Health Surveys, 1996, 2001, 2006.

Related articles
External links
Friedrich Huebler, 26 September 2007 (edited 12 October 2008), Creative Commons License
Permanent URL: http://huebler.blogspot.com/2007/09/secondary-school-attendance-in-nepal.html

Tuesday, August 14, 2007

Primary school attendance in Nepal, 1996-2006

In 2006, a Demographic and Health Survey (DHS) collected data on school attendance in Nepal. A comparison with data from earlier DHS surveys, conducted in 1996 and 2001, shows a steady increase in primary school attendance over the last decade. The primary school net attendance rate (NAR) - the share of children of primary school age who attend primary school - has increased by almost 10 percentage points every five years, from 65 percent in 1996 to 84 percent in 2006. If Nepal can sustain this rate of increase it will reach the Millennium Development Goal of universal primary education by 2015.

The increase in attendance was accompanied by a reduction in disparities between boys and girls, residents of urban and rural areas, and children from different household wealth quintiles (see the graph and table below). Much of the increase in primary school attendance is due to higher attendance rates in rural areas, especially over the period 2001 to 2005, when attendance in urban areas grew only marginally.

Primary school net attendance rate (%), Nepal 1996-2006
Bar graph with trends in primary school attendance in Nepal, 1996-2006
Data source: Nepal Demographic and Health Surveys, 1996, 2001, 2006.

Children from the poorest 20 percent of all households saw the biggest increase in primary school attendance, from 48 percent in 1996 to 77 percent 2006. The difference in the primary NAR between children from the richest and poorest household quintiles fell by more than half over the same period, from 42 percent in 1996 to 20 percent in 2006.

Nepal also achieved a marked reduction in gender disparity over the past 10 years. In 1996, only 56 percent of all girls of primary school age attended primary school. This share grew to 82 percent by 2006. The primary NAR of boys grew from 74 percent to 86 percent over the same period. With a gender parity index (GPI) of 0.95 - the ratio of female to male NAR - Nepal has almost reached the Millennium Development Goal of gender parity in primary education.

Primary school net attendance rate (%), Nepal 1996-2006

199620012006Change 1996 to 2006
Total65.173.584.119.0
Male73.679.986.012.3
Female56.466.882.025.6
Urban84.389.890.25.9
Rural63.672.083.219.6
Poorest 20%48.459.676.728.3
Second 20%59.767.479.820.1
Middle 20%62.075.184.322.3
Fourth 20%72.678.286.914.3
Richest 20%90.694.396.96.2
Data source: Nepal Demographic and Health Surveys, 1996, 2001, 2006.

Comments on the 2006 DHS data

The authors of the final survey report from the 2006 DHS in Nepal counted children in school-based pre-primary centers as primary school students for the calculation of the primary school NAR. Children in informal, community based preschool classes were excluded from the calculation of the primary NAR. The author of this article chose the same approach.

A UNESCO country profile of Nepal prepared for the Education for All Global Monitoring Report 2007 explains that "there are significant differences in the way the school based and the community based [early childhood development centres] are running. Most of the school based centres are run by the DEO [District Education Office], and most of them are more primary schools than development centres."

The statement by UNESCO supports the treatment of children in school-based pre-primary centers in Nepal as equivalent to children in primary school for statistical purposes. In developing countries it is not uncommon to find children of primary school age in preschool but because of national differences the interpretation of the data from Nepal cannot necessarily be applied to other countries.

Related articles
External links
Friedrich Huebler, 14 August 2007 (edited 12 October 2008), Creative Commons License
Permanent URL: http://huebler.blogspot.com/2007/08/primary-school-attendance-in-nepal-1996.html

Sunday, August 5, 2007

Disparity between male and female literacy rates

Millennium Development Goal 3 calls for gender equality and the empowerment of women. One aspect of gender equality is literacy among men and women. In June 2007, the UNESCO Institute for Statistics (UIS) released new statistics on adult literacy and youth literacy. The adult literacy rate represents the population aged 15 years and older and the youth literacy rate the population aged 15 to 24 years. The most recent literacy data is from the year 2005.

Figure 1 compares the male and female literacy rates in 135 countries. The male literacy rate is plotted along the horizontal axis and the female literacy rate along the vertical axis. For each country, up to two points are drawn, one for adult literacy and one for youth literacy. The location of a country relative to the 45 degree line indicates whether more men or women are literate. If the literacy rate of men and women is the same, the country's marker is located on the 45 degree line. If the male literacy rate is higher than the female literacy rate, the marker is below the 45 degree line. In countries above the 45 degree line, a higher share of women is literate.

Figure 1: Male and female literacy rates
Scatter plot of male and female literacy rates by country
Source: UNESCO Institute for Statistics, Data Centre, June 2007.

The distribution of the points in Figure 1 shows clearly that in most countries the female literacy rate is below the male literacy rate. In Afghanistan, only 12.6 percent of all women over 15 years can read and write, compared to 43.1 percent of men. In Chad, the female literacy rate is 12.8 percent and the male literacy rate 40.8 percent. In four more countries, fewer than 20 percent of all women are literate: Niger (15.1 percent), Mali (15.9 percent), Burkina Faso (16.6 percent), and Guinea (18.1 percent). In 23 countries in total, less than half of the adult female population can read and write.

Male literacy rates are generally at a higher level but 8 countries have male adult literacy rates below 50 percent. In addition to Afghanistan and Chad, these countries are: Burkina Faso (male literacy rate 31.4 percent), Mali (32.7 percent), Guinea (42.6 percent), Niger (42.9 percent), Sierra Leone (46.7 percent), and Benin (47.9 percent).

Table 1 summarizes the literacy data from UNESCO. On average, the difference between male and female literacy rates is 12.8 percent among the adult population and 7.2 percent among the population aged 15 to 24 years. The smaller gender disparity among youth is due to trends in school attendance over the past years. Attendance has increased for both boys and girls but attendance rates have grown at a faster pace among girls.

Table 1: Male and female literacy rates
Adult or youth literacyCountries
with data
Male literacy
rate (%)
Female literacy
rate (%)
Difference male-female
literacy rate (%)
Adult literacy (15 years and older)13584.972.112.8
Youth literacy (15-24 years)13289.482.27.2
Source: UNESCO Institute for Statistics, Data Centre, June 2007. Average values are weighted by each country's adult and youth population.

In spite of the movement towards gender equality, large gaps remain. In four countries, the gap between male and female literacy among the adult population is greater than 30 percent: Yemen (male literacy rate 73.1 percent, female 34.7 percent, difference 38.4 percent), Central African Republic (male 64.8, female 33.5, difference 32.3), Afghanistan (male 43.1, female 12.6, difference 30.5), and Togo (male 68.7, female 38.5, difference 30.2). In 18 more countries, the male-female gap is between 20 and 30 percent. These countries are, in descending order of the size of the gap: Mozambique (difference male-female literacy rate 29.9 percent), Pakistan, Angola, Chad, Niger, Nepal, Ethiopia, Democratic Republic of the Congo, Morocco, India, Benin, Guinea, Egypt, Sierra Leone, Cote d'Ivoire, Senegal, Malawi, and Cambodia (difference 20.6 percent).

In a few countries, female literacy rates are above male literacy rates. In Lesotho, 90.3 percent of all women aged 15 years and older are literate, compared to 73.7 percent of all men (difference 16.6 percent). In Jamaica, the adult literacy rate is 85.9 percent among women and 74.1 percent among men (difference 11.8 percent). In four more countries, the literacy rate of women is between 3 and 1 percent above the male literacy rate: Malta, Philippines, Botswana, and Uruguay.

The youth literacy rate among the female population is more than 1 percentage point above the male literacy rate in 16 countries (listed in descending order of the gap): Nicaragua, Liberia, Honduras, El Salvador, Botswana, Malta, Philippines, Swaziland, Qatar, Dominican Republic, Namibia, Brazil, Venezuela, Mauritius, Mongolia, and Sri Lanka. The difference between female and male youth literacy rates in this group of countries ranges from 5.2 percent in Nicaragua to 1.1 percent in Sri Lanka.

In 15 countries, the male youth literacy rate is 20 or more percent above the female youth literacy rate. These countries are, in descending order of the literacy gap: Chad (difference male-female literacy rate 32.5 percent), Afghanistan, Yemen, Niger, Benin, Guinea, Ethiopia, Pakistan, Central African Republic, Mozambique, Sierra Leone, Angola, Nepal, Morocco, and Togo (difference 20.1 percent).

To download the latest national literacy rates, please visit the UIS Data Centre.

Related articles
External links
Friedrich Huebler, 5 August 2007 (edited 17 October 2008), Creative Commons License
Permanent URL: http://huebler.blogspot.com/2007/08/disparity-between-male-and-female.html

Sunday, July 29, 2007

UN Millennium Development Goals Report 2007

Cover of UN MDG Report 2007In June 2007, the United Nations published the latest edition of its annual report on progress toward the Millennium Development Goals (MDG). The Millennium Development Goals Report 2007 presents data for each of the eight MDGs.
  1. Eradicate extreme poverty and hunger
  2. Achieve universal primary education
  3. Promote gender equality and empower women
  4. Reduce child mortality
  5. Improve maternal health
  6. Combat HIV/AIDS, malaria and other diseases
  7. Ensure environmental sustainability
  8. Develop a global partnership for development
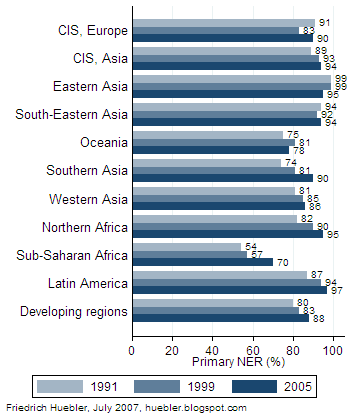
In the section on MDG 2, the achievement of universal primary education, the report shows trends in primary school enrollment from 1991 to 2005. The statistics are presented by MDG region. One region, the Commonwealth of Independent States, is further divided into countries in Europe and Asia.

Primary school net enrollment rate, 1991-2005
Bar graph with regional primary school net enrollment rates from 1991 to 2005
Source: United Nations, The Millennium Development Goals Report 2007, page 10.

Seven regions have reached primary school net enrollment rates at or above 90 percent: Commonwealth of Independent States (Europe and Asia), Eastern Asia, South-Eastern Asia, Southern Asia, Western Asia, Northern Africa, and Latin America. Western Asia is slightly behind with a primary NER of 86 percent, followed by Oceania at 78 percent.

Sub-Saharan Africa has made the most progress over the past years, with a 13 percent increase in the primary NER from 57 percent in 1999 to 70 percent in 2005. Still, three out of ten children of primary school age in Sub-Saharan Africa are not enrolled in primary school. In all developing regions combined, the primary NER rose from 80 percent in 1991 to 88 percent in 2005.

Related articles
External links
Friedrich Huebler, 29 July 2007 (edited 17 October 2008), Creative Commons License
Permanent URL: http://huebler.blogspot.com/2007/07/un-millennium-development-goals-report.html

Sunday, July 22, 2007

Disparity between adult and youth literacy

Two recent articles on this web site present the latest data from the UNESCO Institute for Statistics (UIS) on adult literacy and youth literacy worldwide. The adult literacy rate refers to the population aged 15 years and over, the youth literacy rate to the population aged 15 to 24 years. Youth literacy is generally higher than adult literacy, due to increasing levels of school attendance over the past decades.

The scatter plot in Figure 1 compares adult and youth literacy in 133 countries with data. The adult literacy rate is plotted along the horizontal axis and the youth literacy rate along the vertical axis. Almost all countries are located above the 45 degree line in the graph, which means that youth literacy is higher than adult literacy. Countries with no difference between the two literacy rates are located along the 45 degree line.

Figure 1: Adult and youth literacy: all countries with data
Scatter plot of adult and youth literacy rates by country
Source: UNESCO Institute for Statistics, Data Centre, June 2007.

Many countries are located close together in the upper right corner of Figure 1. To show the distribution in that part of the graph more clearly, Figure 2 plots only the 87 countries with literacy rates above 80 percent. Because of the scale, the difference between adult and youth literacy is exaggerated compared to Figure 1. The shape and color of the markers in both graphs indicate the Millennium Development Goal (MDG) region in which each country is located. The lowest literacy rates, below 60 percent, are reported for countries in Sub-Saharan Africa and Southern Asia.

As Figure 2 shows, some countries from Sub-Saharan Africa and Southern Asia have highly literate populations, with literacy rates above 80 or 90 percent. Other countries with high literacy rates are located in Latin America and the Caribbean, Western Asia, South-eastern Asia, and the other MDG regions. Developed countries and countries from the Commonwealth of Independent States are clustered in the upper right corner of Figure 2, near 100 percent adult and youth literacy.

Figure 2: Adult and youth literacy: countries with literacy rates above 80 percent
Scatter plot of adult and youth literacy rates by country
Source: UNESCO Institute for Statistics, Data Centre, June 2007.

The average literacy rates in each MDG region are listed in Table 1. The mean literacy rates are simple unweighted averages across the countries with literacy data in a region and the values are therefore not representative for the entire population in each region.

Table 1 confirms the impression from Figure 1: adult and youth literacy rates are lowest in Sub-Saharan Africa and Southern Asia. In both regions, less than two thirds of the adult population are literate and the youth literacy rate is 10 to 12 percent higher than the adult literacy rate. In Western Asia, the youth literacy rate is also 10 percent above the adult literacy rate, but with an adult literacy rate of 85 percent, many more people can read and write than in Sub-Saharan Africa and Southern Asia.

The difference between the two literacy rates is greatest in Northern Africa, where 88 percent of the population aged 15 to 24 years are literate, compared to 70 percent of the population aged 15 years or more. Based on the available data, smaller gaps between adult and youth literacy exist in Eastern Asia, South-eastern Asia, Oceania, and Latin America and the Caribbean. In the developed countries and in the countries of the Commonwealth of Independent States, nearly the entire adult population is literate.

Table 1: Adult and youth literacy by MDG region
MDG regionCountries
with data in region
Adult literacy
rate (%)
Youth literacy
rate (%)
Difference youth-adult
literacy rate (%)
Developed countries1697.199.12.1
Commonwealth of Independent States1099.299.80.6
Eastern Asia393.398.75.4
South-eastern Asia1086.993.76.8
Oceania482.288.43.5
Southern Asia863.175.112.0
Western Asia1485.194.89.8
Northern Africa570.487.617.2
Sub-Saharan Africa4261.571.110.3
Latin America and the Caribbean2589.194.85.3
World13779.487.07.5
Source: UNESCO Institute for Statistics, Data Centre, June 2007. Regional averages are unweighted. 137 countries have data on adult literacy, 133 countries have data on youth literacy.

Please visit the UIS Data Centre to download complete tables with national data on adult and youth literacy.

Related articles
External links
Friedrich Huebler, 22 July 2007 (edited 17 October 2008), Creative Commons License
Permanent URL: http://huebler.blogspot.com/2007/07/disparity-between-adult-and-youth.html

Sunday, July 15, 2007

Youth literacy rates

Last week, I posted an article on adult literacy with the latest statistics from the UNESCO Institute for Statistics (UIS). Today's article will look at the latest statistics on youth literacy. The youth literacy rate is the share of the population aged 15 to 24 years that is literate.

UNESCO provides national data on youth literacy for 133 countries. This compares to 137 countries for which the adult literacy rate is known. The youth literacy rate is usually higher than the adult literacy rate, especially in developing countries where the education system has expanded over the past decades. In a country where school attendance rates increase over time, persons born in a later year are more likely to attend school and to become literate.

The map below displays the youth literacy rate for each country with data, ranging from 24.2 percent in Mali to 100 percent in Cuba. Most industrialized countries have no data on youth literacy, but school attendance is almost universal in these countries and literacy rates are therefore also high.

Youth literacy rates by country
World map with youth literacy rate by country
Source: UNESCO Institute for Statistics, Data Centre, June 2007.

In Eastern Europe, East and Southeast Asia, and Latin America, youth literacy rates are generally 90 percent or higher. In some countries in Africa and the Middle East, youth literacy rates are also at or above 90 percent. Of 133 countries with data, 87 report youth literacy rates between 90 and 100 percent. 10 more countries have literacy rates between 80 and 90 percent.

In 5 countries, less than 40 percent of the population between 15 and 24 years are literate: Mali (youth literacy rate 24.2 percent), Burkina Faso (33.0), Afghanistan (34.3), Niger (36.5), and Chad (37.6). In 8 countries, the youth literacy rate is between 40 and 60 percent: Benin (45.3), Guinea (46.6), Mozambique (47.0), Sierra Leone (47.9), Senegal (49.1), Ethiopia (49.9), Madagascar (57.6), and the Central African Republic (58.5). In the remaining 23 countries, the youth literacy is between 60 and 80 percent.

The complete set of youth and adult literacy statistics is available at the UIS Data Centre.

Related articles
External links
Friedrich Huebler, 15 July 2007 (edited 22 July 2007), Creative Commons License
Permanent link: http://huebler.blogspot.com/2007/07/youth-literacy-rates.html

Sunday, July 8, 2007

Adult literacy rates

In June 2007, the UNESCO Institute for Statistics (UIS) released its latest literacy statistics, covering the years 1985 to 2005. In a change from literacy statistics released in previous years, UIS only reports on observed literacy and no longer uses proxy variables like educational attainment. The UIS database contains two sets of literacy rates:
  • Youth literacy rate: the share of the population aged 15 to 24 years that is literate.
  • Adult literacy rate: the share of the population aged 15 years and older that is literate.
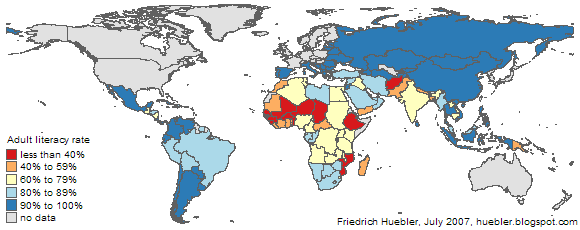
Both literacy rates are reported at the national and regional level. The adult literacy rate is available for 137 countries, shown in the map below. It ranges from 23.6 percent in Burkina Faso to 99.8 percent in Cuba. For 71 countries, the adult literacy rate is unknown but most of these countries are industrialized and literacy can therefore be assumed to be at a high level.

Adult literacy rates by country
World map with adult literacy rate by country
Source: UNESCO Institute for Statistics, Data Centre, June 2007.

Among countries with data, the highest literacy rates are observed in Eastern Europe, East and Southeast Asia, and Latin America. Virtually all countries in these regions have literacy rates above 80 percent. Some countries in Africa also report adult literacy rates at such a high level. In 57 countries worldwide, more than 90 percent of the adult population are literate. 31 countries have literacy rates between 80 and 90 percent.

The lowest literacy rates are observed in Africa and South Asia. In 6 countries, fewer than 3 out of 10 adults are literate: Burkina Faso (adult literacy rate 23.6 percent), Mali (24.0), Chad (24.7), Afghanistan (28.0), Niger (28.7), and Guinea (29.5). In 10 countries, the adult literacy rate is between 30 and 50 percent: Benin (34.7), Sierra Leone (34.8), Ethiopia (35.9), Mozambique (38.7), Senegal (39.3), Bangladesh (47.5), Central African Republic (48.6), Nepal (48.6), Cote d'Ivoire (48.7), and Pakistan (49.9).

In India, the second most populous country in the world, only 6 out of 10 adults are literate (literacy rate 61.0 percent). In China, the country with the largest population, many more people can read and write, with an adult literacy rate of 90.9 percent.

The complete set of literacy statistics is available at the UIS Data Centre.

Related articles
External links
Friedrich Huebler, 8 July 2007 (edited 22 July 2007), Creative Commons License
Permanent link: http://huebler.blogspot.com/2007/07/adult-literacy-rates.html