The present article takes a closer look at primary and secondary school attendance rates in Nepal. The data was collected in a Demographic and Health Survey (DHS) in 2001. DHS surveys are nationally representative household surveys that are carried out with support from the U.S. Agency for International Development. With the DHS data it is possible to examine disparities in the education system that go beyond gender.
In Nepal, the official primary school age is 5 to 9 years. The official secondary school age is 10 to 16 years. The primary school net attendance rate (NAR) in 2001 is shown in Figure 1 and the secondary school NAR in Figure 2.
Overall, 73.5 percent of all children of primary school age were attending primary school. In spite of the progress toward gender parity over the past two decades, girls still attend primary school to a lesser degree than boys. The primary NAR of girls is 66.8 percent, compared to 79.9 percent for boys. However, other disparities in school attendance are larger than the male-female disparity. In rural areas, 72.0 percent of children of primary school age are in school, compared to 89.8 percent in urban areas. The biggest disparities are linked to household wealth. In the richest 20 percent of all household in Nepal, the primary NAR is 94.3 percent. As household wealth declines, the primary NAR also falls and among children from the poorest 20 percent of all households, the primary NAR is only 59.6 percent.
Figure 1: Primary school attendance in Nepal
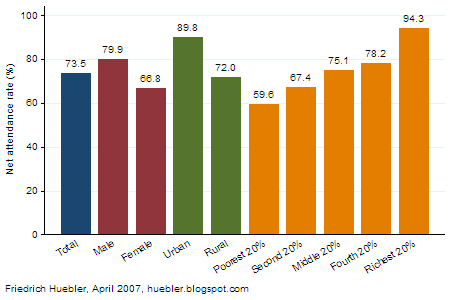
Source: Nepal 2001 Demographic and Health Survey (DHS).
Less than half of all Nepali children continue their education at the secondary level. In the country as a whole, 30.9 percent of all children of secondary school age attend secondary school. Among boys, the secondary NAR is 35.1 percent, compared to 26.6 percent among girls. As at the primary level, the disparities linked to the area of residence and to household wealth are larger than the disparities linked to gender. In urban areas, the secondary NAR is 50.6 percent and in rural areas it is 28.7 percent. One likely explanation for this difference is the scarcity of secondary schools in rural Nepal. The link between poverty and school attendance at the secondary level of the education system is even stronger than at the primary level. For children from the richest 20 percent of all households, the secondary NAR is 57.0 percent. Among the poorest 20 percent of all households the secondary NAR is 14.6 percent, less than a quarter of the NAR in the richest households.
Figure 2: Secondary school attendance in Nepal
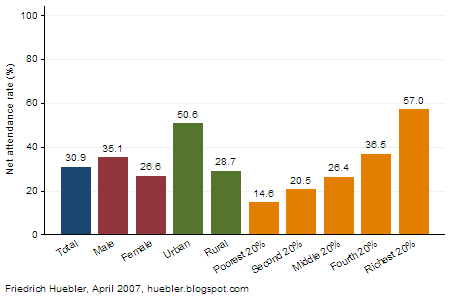
Source: Nepal 2001 Demographic and Health Survey (DHS).
In conclusion, whereas Nepal has been able to move towards gender disparity in its education system, children from rural areas and from poorer households continue to be at a great disadvantage.
Note: In this article, the primary school NAR is defined as the share of children of primary school age who are attending primary or secondary school. Attendance at the secondary level is included because children of primary school age in secondary school would otherwise be counted as out of school. Similarly, the secondary school NAR counts children of secondary school age in secondary or higher education as attending secondary school.
Related articles
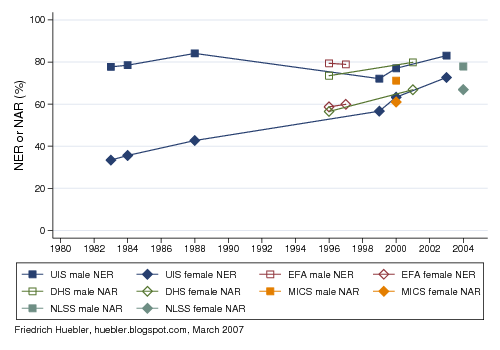
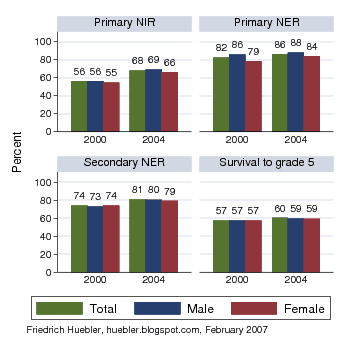
- Nepal: trends in primary education, 1980-2004
- Education disparity in South Asia
- Education data from household surveys
Friedrich Huebler, 30 April 2007 (edited 12 October 2008), Creative Commons License
Permanent URL: http://huebler.blogspot.com/2007/04/primary-and-secondary-school-attendance.html