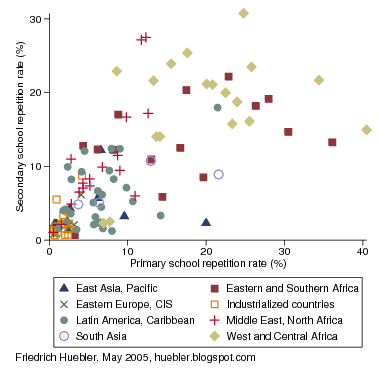
In the graph below, the primary school NER is plotted along the horizontal axis and the secondary school NER along the vertical axis. 151 countries are shown, with symbols that indicate the UNICEF region to which they belong. For the remaining countries the Global Education Digest contains no data on primary or secondary school enrollment.
Primary and secondary school net enrollment ratio, 2002/03
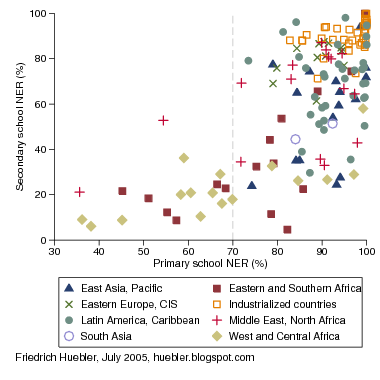
Data source: UNESCO Institute for Statistics (UIS). 2005. Global Education Digest 2005. Montreal: UIS.
The secondary school NER does not increase proportionally with primary school enrollment. In 19 of the countries in the graph, the primary school NER is less than 70%; in 17 of these countries the secondary school NER does not rise above 30%. All countries in this group are from Africa or the Middle East. If the primary school NER in a country is above 70%, children are much more likely to continue their education at the secondary level. However, even in this group many countries, mostly from Africa, are struggling to raise secondary school enrollment.
In the following table, all countries are grouped according to the primary school NER. For each group, the average secondary school NER and the number of countries in the group are listed. Secondary school enrollment does increase with primary school enrollment but for countries with a primary school NER above 70% this increase in secondary school enrollment is relatively steeper. In the 86 countries with a primary school NER above 90%, on average three out of four children of secondary school age (73.8%) go to secondary school.
Average secondary school net enrollment ratio by level of primary school net enrollment, 2002/03
| Primary school NER | Average secondary school NER (%) | Number of countries |
| 30 to 39.9% | 8.0 | 3 |
| 40 to 49.9% | 18.8 | 2 |
| 50 to 59.9% | 24.4 | 6 |
| 60 to 69.9% | 25.8 | 8 |
| 70 to 79.9% | 36.4 | 12 |
| 80 to 89.9% | 53.3 | 34 |
| 90 to 100% | 73.8 | 86 |
| Total | 59.7 | 151 |
Note: Average values are weighted by each country's population of secondary school age.
Friedrich Huebler, 10 July 2005, Creative Commons License