Sunday, May 22, 2005

Primary school enrollment 2002/03

All UN member states have agreed to reach a set of Millennium Development Goals by the year 2015. The MDGs address poverty in its many dimensions and one goal is to "ensure that, by 2015, children everywhere, boys and girls alike, will be able to complete a full course of primary schooling."

At the end of April, the UNESCO Institute for Statistics released the Global Education Digest 2005 with the latest global education indicators, in most cases for the 2002/03 school year. The map below indicates the primary school net enrollment ratio (NER) in each country, that is the share of children of primary school age that are currently enrolled in primary school. For several countries, among them Argentina, China and the Democratic Republic of the Congo, no reliable statistics were available.

Primary school net enrollment ratio, 2002/2003
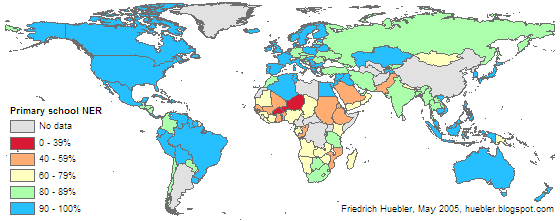
Map of the world showing primary school net enrollment rate for each country in 2002/03
Data source: UNESCO Institute for Statistics (UIS). 2005. Global Education Digest 2005. Montreal: UIS.

Worldwide, 84% of all children of primary school age were enrolled in primary school. The highest NER values - above 90% - were reported for the industrialized countries, Latin America and the Caribbean, and East Asia and the Pacific. School enrollment is lowest in West and Central Africa (61%) and in Eastern and Southern Africa (69%). Many countries in these regions are far from the goal of universal primary education.

Primary school net enrollment ratio, 2002/03
RegionPrimary school NER (%)
MaleFemaleTotal
East Asia, Pacific92.290.591.2
Eastern and Southern Africa70.767.869.3
Eastern Europe, CIS89.286.687.9
Industrialized countries95.596.095.7
Latin America, Caribbean95.193.695.0
Middle East, North Africa83.977.780.9
South Asia85.879.983.0
West and Central Africa67.954.661.4
World85.881.583.8
Data source: UNESCO Institute for Statistics (UIS). 2005. Global Education Digest 2005. Montreal: UIS.
Note: Regional values are weighted by each country's population of primary school age.


In addition to having the lowest share of children in school, West and Central Africa is also the region with the highest gender disparity. Among boys, 68% were enrolled in primary school, compared to only 55% of girls.

Friedrich Huebler, 22 May 2005, Creative Commons License

Wednesday, May 18, 2005

Global Education Digest 2005

UNESCO has released the Global Education Digest 2005, with data for the 2002/03 school year. In the coming weeks I will present the latest data on primary and secondary school enrollment, on the gender disparity in primary and secondary school, and on other aspects of education, including repetition rates and school life expectancy.

I will also begin to present data from household surveys. Two important sources of data on education are the Multiple Indicator Cluster Surveys (MICS) of UNICEF and the Demographic and Health Surveys (DHS) that were initiated by the U.S. Agency for International Development (USAID).

Friedrich Huebler, 18 May 2005, Creative Commons License
Monday, May 9, 2005

Repetition rates in primary and secondary school

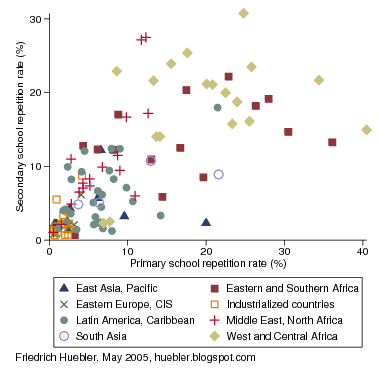
A comparison of primary school gross and net enrollment rates indicates that there is a high share of late entrants and grade repeaters in Sub-Saharan Africa. Repetition rates in primary and secondary school are listed in the Global Education Digest 2004 from UNESCO. Primary repetition rates are available for 138 countries, secondary repetition rates for 125 countries. The most recent values for each country are plotted in the graph below, with regions, as defined by UNICEF, indicated by different symbols.

Repetition rates in primary and secondary school, 2001/02
Graph with primary and secondary school repetition rates
Data source: UNESCO Institute for Statistics (UIS). 2004. Global Education Digest 2004. Montreal: UIS.

The 15 countries with the highest share of repeaters at the primary level are located in West and Central Africa or Eastern and Southern Africa. The highest primary school repetition rates are observed in Equatorial Guinea (40.5%), Rwanda (36.1%) and Gabon (34.4%). Of the 17 countries with the highest share of repeaters at the secondary level, 15 are in Sub-Saharan Africa and 2 in the Middle East and North Africa. The highest secondary school repetition rates exist in Congo (30.8%), Iraq (27.5%), and Algeria (27.2%).

Average repetition rates per region, primary and secondary school, 2001/02
RegionRepetition rate (%)
Primary schoolSecondary school
East Asia, Pacific1.9
2.2
Eastern and Southern Africa12.4
12.3
Eastern Europe, CIS1.2
1.2
Industrialized countries2.1
3.9
Latin America, Caribbean10.0
7.4
Middle East, North Africa8.0
12.9
South Asia4.5
5.0
West and Central Africa12.9
18.8
World6.0
7.8
Data source: UNESCO Institute for Statistics (UIS). 2004. Global Education Digest 2004. Montreal: UIS.
Note: Regional values are weighted by each country's population of primary school age.


Regional averages, weighted by each country's population of primary school age, are listed in the table above. Worldwide, 6.0% of primary students and 7.8% of secondary students repeat a grade. In primary school, repetition rates are highest in West and Central Africa (average repetition rate 12.9%), Eastern and Souther Africa (12.4%), and Latin America and the Caribbean (10.0%). In secondary school, the highest repetition rates are observed in West and Central Africa (18.8%), the Middle East and North Africa (12.0%), and in Eastern and Southern Africa (12.3%).

In East Asia and the Pacific, Eastern Europe and Central Asia, the industrialized countries, and South Asia, not more than 5% of pupils at the primary or secondary level repeat a grade.

Friedrich Huebler, 9 May 2005, Creative Commons License
Sunday, May 1, 2005

School life expectancy

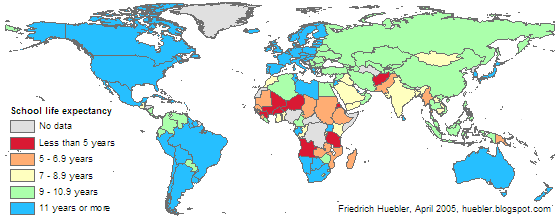
The school life expectancy is the number of years a person of school entrance age can expect to spend in school. This indicator combines information on enrollment rates in primary and secondary education and can therefore be used to compare countries with different lengths of primary or secondary school. In addition, this indicator compensates for late entry into the education system. One limitation is that years spent repeating a grade also count as years spent in school. In countries where repetition rates are high the school life expectancy can therefore be inflated.

School life expectancy in years, primary to secondary education, 2001/02
Map showing average school life expectancy in years per country
Data source: UNESCO Institute for Statistics (UIS). 2004. Global Education Digest 2004. Montreal: UIS.

Average school life expectancy in years per region, primary to secondary education, 2001/02
RegionSchool life expectancy (years)
East Asia, Pacific9.7
Eastern and Southern Africa7.5
Eastern Europe, CIS9.9
Industrialized countries12.6
Latin America, Caribbean11.7
Middle East, North Africa9.2
South Asia7.9
West and Central Africa6.0
World9.3
Data source: UNESCO Institute for Statistics (UIS). 2004. Global Education Digest 2004. Montreal: UIS.
Note: Regional values are weighted by each country's population under 18 years of age.

The Global Education Digest 2004 from UNESCO contains data on school life expectancy for nearly all countries. The global average is 9.3 expected years of schooling for every child. At the regional level, the school life expectancy is highest in the industrialized countries (12.6 years) and in Latin America (11.7 years). The lowest school life expectancy is observed in West and Central Africa (6 years) and in Eastern and Southern Africa (7.5 years). Sub-Saharan Africa also has the lowest primary and secondary school enrollment rates.

Friedrich Huebler, 1 May 2005, Creative Commons License

Saturday, April 23, 2005

Primary school gross and net enrollment

The primary school net enrollment ratio (NER) is the share of children of official primary school age that are enrolled in primary school; the NER cannot exceed 100%. The gross enrollment ratio (GER) is the share of children of any age that are enrolled in primary school. In countries where many children enter school late or repeat a grade the GER can exceed 100%.
  • NER = Enrolled children in the official school age group / Total number of children in the official school age group
  • GER = Enrolled children of all ages / Total number of children in the official school age group
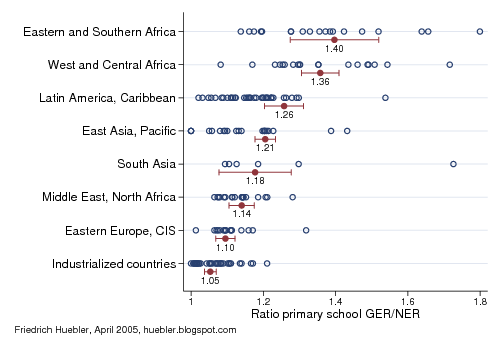
If many children outside of the official primary school age range are enrolled in primary school, the GER can exceed the NER by a large margin. A comparison of primary school NER and GER can therefore indicate where delayed enrollment and grade repetition are most widespread. The following table lists the average NER and GER by region, as well as the difference between GER and NER and the ratio of GER over NER. The regional values are weighted by the population of primary school age in each country.

RegionPrimary school NER (%)Primary school GER (%)Difference GER-NERRatio
GER/NER
East Asia, Pacific92.0
110.9
18.9
1.21
Eastern and Southern Africa63.6
92.0
23.4
1.40
Eastern Europe, CIS87.6
99.7
8.2
1.10
Industrialized countries95.9
101.0
5.0
1.05
Latin America, Caribbean95.2
119.7
24.5
1.26
Middle East, North Africa80.6
91.4
10.5
1.14
South Asia81.4
94.1
14.4
1.18
West and Central Africa48.8
79.9
17.2
1.36
World84.1
99.9
16.0
1.20
Data source: UNESCO Institute for Statistics (UIS). 2004. Global Education Digest 2004. Montreal: UIS.

The blue circles in the graph below indicate the GER/NER ratio for each country. The red marks indicate the average GER/NER value in each region, listed in the table above, and the 95% confidence interval for this average.

Primary school gross and net enrollment ratios, 2001/2002
Graph showing ratio of primary school gross/net enrollment ratio by region
Data source: UNESCO Institute for Statistics (UIS). 2004. Global Education Digest 2004. Montreal: UIS.
Note: Red marks indicate the regional average of GER/NER and the 95% confidence interval.


West and Central Africa, and Eastern and Southern Africa stand out as the two regions with the highest GER/NER ratios, 1.40 and 1.36, respectively. Children in Sub-Saharan Africa often enter school late and stay at the primary level well past primary school age. Latin America and the Caribbean, and East Asia and the Pacific also have GER/NER values above the global average of 1.20, but at much higher net enrollment ratios than the countries of Sub-Saharan Africa.

Friedrich Huebler, 23 April 2005 (edited 24 April 2005), Creative Commons License

Wednesday, April 20, 2005

Regional trends in secondary school enrollment

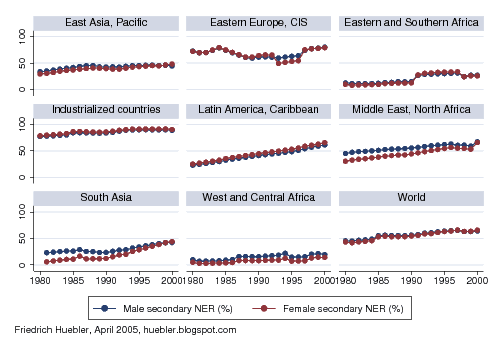
Trend data from UNESCO shows that the primary school net enrollment ratio (NER) has increased at the global level from 78% in 1980 to 88% in 2000. Secondary school enrollment has also increased, from 44% in 1980 to 67% in 2000 (see the graph below). In contrast to primary education, there has been virtually no gender disparity in secondary education since the 1980s. In 1980, the global secondary school NER of boys was 2% above that of girls but by 2000 the situation was reversed, with boys lagging behind girls by almost 2%.

An analysis of regional trends in secondary education is less reliable than a similar analysis at the primary level because of a lack of data. A previous post on secondary school enrollment made clear that for many countries in Africa and South Asia the secondary school NER is unknown. In East Asia, there is no data for China and in Eastern Europe, there is no data for Russia. For these regions, the trends presented below should therefore be interpreted with caution.

Secondary school net enrollment ratio, 1980-2000
Graph showing secondary school net enrollment rate between 1980 and 2000 for each UNICEF region
Data sources: UNESCO Institute for Statistics (UIS). 2004. Global Education Digest 2004. Montreal: UIS. - World Education Indicators, UNESCO Institute for Statistics, March 2005.

The regional groupings in the graph were adopted from UNICEF (see the map in a post on regional trends in primary school enrollment). Of all regions, Latin America and the Caribbean witnessed the strongest increase in secondary school enrollment; in 1980, the secondary school NER was 27% and in 2000 it was 63%. In the Middle East and North Africa and in South Asia, the countries for which UNESCO provides data managed not only to increase enrollment overall, they also reached gender parity in secondary education. As in primary education, Sub-Saharan Africa continues to lag behind the other regions.

Friedrich Huebler, 20 April 2005, Creative Commons License

Friday, April 8, 2005

Gender disparity in secondary school

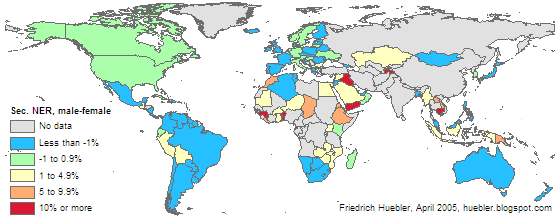
The Millennium Development Goals challenge all UN member states to "eliminate gender disparity in primary and secondary education, preferably by 2005, and in all levels of education no later than 2015." The current state of gender disparity can be assessed with data from the Global Education Digest 2004 from UNESCO, which has estimates for the male and female secondary school net enrollment ratio (NER) in 141 countries. This data was used to create the map below.

Gender disparity in secondary school: male-female net enrollment ratio, 2001/2002
Map of the world showing male-female disparity in secondary school net enrollment rate for each country
Data source: UNESCO Institute for Statistics (UIS). 2004. Global Education Digest 2004. Montreal: UIS.

Compared to primary education, girls are not as disadvantaged in secondary education. On the contrary, in many countries the enrollment of boys lags behind that of girls. This is the case in 29 of 34 countries in Latin America and in 32 of 34 industrialized countries. The opposite is true in West and Central Africa: in 11 of the 12 countries with data in this region, girls have lower enrollment rates than boys. (Regions follow the grouping used by UNICEF.) Overall, in 96 countries girls are favored and in 45 countries boys are favored.

In eight countries, the secondary school NER of girls is 10 percentage points or more above that of boys: Suriname (22% difference in NER), St. Lucia (18%), St. Kitts and Nevis (17%), Mongolia (13%), Dominican Republic and Namibia (12%), and the Philippines and St. Vincent and the Grenadines (10%). In eight other countries, the secondary school NER of boys is 10 percentage points or more above that of girls: Yemen (26% difference), Togo (19%); Benin, Equatorial Guinea, Iraq, and Tajikistan (14%); Guinea (11%), and Cambodia (10%). In 63 countries, the difference between the male and female NER is in the range ±3%.

Related articles
Friedrich Huebler, 9 April 2005 (edited 12 October 2008), Creative Commons License
Permanent URL: http://huebler.blogspot.com/2005/04/gender-disparity-in-secondary-school.html