Sunday, April 13, 2008

Reported and tested literacy in Nigeria

Household surveys like the Demographic and Health Surveys (DHS) or the Multiple Indicator Cluster Surveys (MICS) collect data on literacy with various methods. One approach is to simply ask respondents whether they can read and write. In an alternative approach, the reading ability is tested by asking respondents to read a sentence from a card. More detailed assessments of literacy, such as the National Assessment of Adult Literacy in the United States, require in-depth questionnaires that are beyond the scope of surveys like the DHS and MICS.

The Nigeria DHS of 2003 collected literacy data with two methods. First, the survey questionnaire contained the question: "Can (name) read and write in any language with understanding?" This question was asked for all household members aged 5 years and older, with two possible answers: yes or no (NPC and ORC Macro 2004: 247). The results of this literacy assessment were described in the article "Adult literacy in Nigeria", published on this site on 5 April 2008.

Second, a randomly selected subsample of women between 15 and 49 years and men between 15 and 59 years were asked to read a card with a simple sentence in their language. If the respondent could not read the whole sentence, the survey staff were asked to probe if the respondent could read any part of the sentence. The result was recorded as one of three options: (1) cannot read at all, (2) able to read only parts of sentence, or (3) able to read whole sentence. If no card in the respondents' language was available, or if the respondent was blind or visually impaired, the result was recorded in a separate category (NPC and ORC Macro 2004: 26-27).

The graph and table below compare the data from the two literacy assessment methods - self-reporting and reading test - for the population aged 15 to 49 years. The self-reported literacy rate, the blue bars in the graph, is the share of respondents that claimed to be able to read and write. The tested literacy rate, the red bars in the graph, is the share of respondents that could read a complete sentence; household members who could only read parts of a sentence were counted as illiterate.

Self-reported and tested literacy in Nigeria, population 15-49 years
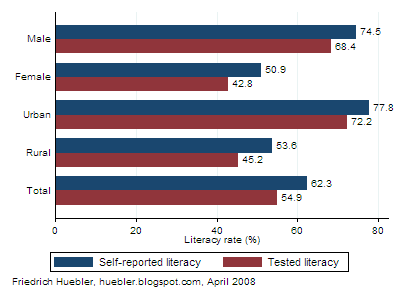
Bar graph with self-reported and tested literacy rates in Nigeria
Source: Nigeria Demographic and Health Survey 2003

A comparison of the self-reported and tested literacy rates in Nigeria shows that self-reporting tends to overestimate the degree of literacy in the population. 62 percent of men and women between 15 and 49 years were reported as able to "read and write in any language with understanding". However, the reading test revealed that only 55 percent could read a simple sentence. The difference of 7 percent can be explained by the fact that survey respondents are reluctant to admit that they themselves or other household members, on whose behalf they respond, are unable to read and write. This gap between self-reported and tested literacy can be observed across all groups of respondents: men, women, urban residents, and rural residents. The biggest difference exists in rural areas of Nigeria, were 54 percent of respondents claim to be literate but only 45 percent can in fact read.

Self-reported and tested literacy in Nigeria, population 15-49 years

Self-reported literacy rate (%) Tested literacy rate (%) Difference (%)
Male 74.5 68.4 6.1
Female 50.9 42.8 8.1
Urban 77.8 72.2 5.6
Rural 53.6 45.2 8.4
Total 62.3 54.9 7.4
Source: Nigeria Demographic and Health Survey 2003

References
  • National Population Commission (NPC) [Nigeria] and ORC Macro. 2004. Nigeria Demographic and Health Survey 2003. Calverton, Maryland: National Population Commission and ORC Macro. (Download report, PDF format, 4 MB)
Related articles External linksFriedrich Huebler, 13 April 2008, Creative Commons License
Permanent URL: http://huebler.blogspot.com/2008/04/self-reported-and-tested-literacy-in.html

Saturday, April 5, 2008

Adult literacy in Nigeria

The adult literacy rate is the share of literate persons in the population aged 15 years and older. In Nigeria, a Demographic and Health Survey (DHS) collected data on literacy that can be disaggregated by age, gender, area of residence, and other characteristics. In the survey, conducted in 2003, literacy is defined as the ability to "read and write in any language with understanding" (NPC and ORC Macro 2004: 247). To collect this data, respondents were only asked whether they are literate, but no reading or writing tests were applied. A smaller group of respondents, all women aged 15-49 years and one third of men aged 15-59 years, were asked to read a simple sentence in any of the major language groups of Nigeria (NPC and ORC Macro 2004: 26-27). The literacy rates obtained from this separate reading test were not considered for the analysis that follows, but they are lower than the self-reported literacy rates that cover all survey respondents aged 5 years and older. A separate article on this site describes the difference between self-reported and tested literacy in Nigeria in more detail.

In Nigeria, 55% of the population aged 15 years and older can read and write according to the findings of the DHS. More men (67%) than women (44%) are literate, and the literacy rate is higher in urban (71%) than in rural areas (47%).

Adult literacy rate in Nigeria, 2003
Category
Literacy rate (%)
Male 67.3
Female 43.7
Urban 70.9
Rural 46.8
Total 55.3
Source: Nigeria Demographic and Health Survey 2003

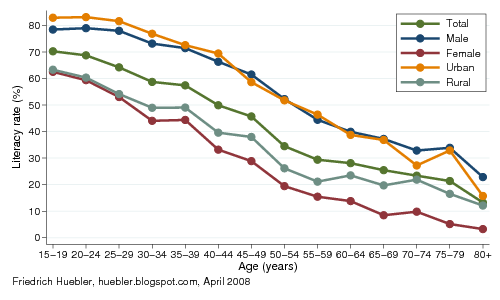
Although almost half of all adult Nigerians cannot read and write, analysis of the survey data by age reveals a steady increase in literacy over the years. Today, more children go to school and learn to read and write than in previous decades. As a result, younger persons are much more likely to be literate than older persons. For the graph below, the survey respondents were divided into 5-year age groups. Among persons aged 15 to 19 years - those who were of primary school age in the 1990s - the literacy rate is 70%. Among persons 80 years or older, only 13% are literate.

A similar rate of increase in the literacy rate can be observed for men, women, urban residents, and rural residents. Among women 80 years or older, only 3% can read and write, compared to 23% of all men in the same age group. Among 15- to 19-year-olds, the female literacy rate is 63% and the male literacy rate 79%. While literacy rates have increased steadily for men and women, there continues to be a large gender gap. A similar gap exists between residents of urban and rural areas.

Adult literacy rate in Nigeria by age, gender and area of residence, 2003
Graph with literacy rates by age, gender and area of residence, Nigeria 2003
Source: Nigeria Demographic and Health Survey 2003

References
  • National Population Commission (NPC) [Nigeria] and ORC Macro. 2004. Nigeria Demographic and Health Survey 2003. Calverton, Maryland: National Population Commission and ORC Macro. (Download report, PDF format, 4 MB)
Related articles

External links

Friedrich Huebler, 5 April 2008 (edited 13 April 2008), Creative Commons License
Permanent URL: http://huebler.blogspot.com/2008/04/adult-literacy-in-nigeria.html

Wednesday, March 12, 2008

Regional distribution of children out of school

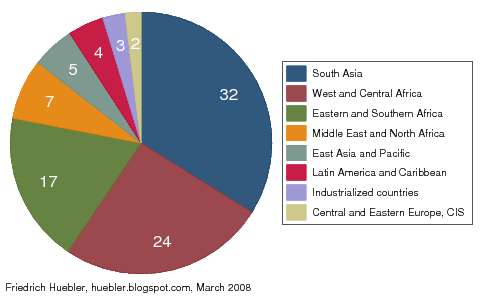
UNICEF estimates that 93 million children of primary school age were out of school in 2006. The graph below presents the regional distribution of these children according to the country classification used by UNICEF. The majority of children out of school, 41 million, lived in Sub-Saharan Africa, the region with the world's lowest primary school enrollment rates. In South Asia, 32 million children were out of school, most of them in India, the country with the world's largest population of children not in school.

In other regions, fewer children of primary school age were not in school. The Middle East and North Africa, East Asia and the Pacific, Latin America and the Caribbean, the industrialized countries, and the countries of Central and Eastern Europe and the Commonwealth of Independent States (CIS) combined account for 20 million children out of school, only one fifth of the global number.

Estimates for individual countries are available on the Childinfo website of UNICEF. The site also describes the data sources and methodology for UNICEF's calculation of the number of children out of school.

Regional distribution of children of primary school age out of school (in millions), 2006
Pie chart with the regional distribution of children out of primary school in 2006
Source: UNICEF, 2007, Progress for Children.

References
  • United Nations Children's Fund (UNICEF). 2007. Progress for children: A World Fit for Children statistical review. New York: UNICEF. (Download PDF, 3.6 MB)
Related articles

External links

Friedrich Huebler, 12 March 2008 (edited 8 February 2009), Creative Commons License
Permanent URL: http://huebler.blogspot.com/2008/03/regional-distribution-of-children-out.html

Monday, March 3, 2008

Global population of primary school age, 2000-2015

The second UN Millennium Development Goal (MDG) is the achievement of universal primary education by the year 2015. Since 2000, many countries have come closer to this goal, but at the current rate of progress it is likely that the goal will be missed when the year 2015 arrives.

To ensure that all children attend and complete primary school, countries have to provide enough schools, teachers, and training materials. Future demographic trends are one factor that has to be taken into consideration to plan for the education system. The UN Population Division provides population projections that can be combined with data on national primary school ages from the UNESCO Institute for Statistics to calculate national and regional trends in the population of primary school age.

The graph and table below depict the population trends by MDG region. At the global level, the number of children of primary school age is projected to increase from 655 million in 2000 to 668 million in 2015. In some regions, the population of primary school age is expected to shrink, while other regions experience a population increase.

Population of primary school age, 2000-2015
Graph with population of primary school age from 2000 to 2015
Data sources: (1) Population: UN Population Division, World Population Prospects 2006. (2) Primary school ages: UNESCO Institute for Statistics, Data Centre.

Two regions with very different trends stand out. In Sub-Saharan Africa, the number of children of primary school age is estimated to grow by 37 percent or 41 million children over the period 2000 to 2015. Countries in this region not only have to provide schools and teachers for all children that have been born so far, they have to increase the capacity of the education system further to accommodate the rapidly growing population. Even wealthy countries with a well-developed education infrastructure would struggle if they had to expand the capacity of their education system by more than one third over a period of 15 years.

In contrast, the population of primary school age in Eastern Asia is expected to drop by 25 percent or 29 million between 2000 and 2015, easing the pressure on the education system. Other regions with a projected decrease in the population of primary school age are the Commonwealth of Independent States and the developed countries. In Latin America and the Caribbean and in South-Eastern Asia, the population is expected to be virtually unchanged.

In Western Asia, Southern Asia, Oceania, and Northern Africa, the projections also show an increase in the population of primary school age, but at a lower relative and absolute level than Sub-Saharan Africa. Countries in the former regions therefore face fewer demographic obstacles on the path to universal primary education than countries in Sub-Saharan Africa.

Population of primary school age, 2000-2015
Region Population of primary school age (million) Change 2000-2015
2000 2015 Million Percent
Oceania 1.1 1.3 0.2 22.8
Commonwealth of Independent States 15.1 12.3 -2.9 -19.0
Northern Africa 19.7 20.0 0.3 1.8
Western Asia 23.9 27.2 3.2 13.5
Latin America and the Caribbean 58.1 57.7 -0.4 -0.7
South-Eastern Asia 63.4 62.9 -0.5 -0.8
Developed countries 67.8 65.0 -2.8 -4.2
Sub-Saharan Africa 111.4 152.5 41.1 36.9
Eastern Asia 117.3 88.2 -29.1 -24.8
Southern Asia 177.0 181.2 4.2 2.4
World 654.9 668.3 13.4 2.0
Data sources: (1) Population: UN Population Division, World Population Prospects 2006. (2) Primary school ages: UNESCO Institute for Statistics, Data Centre.

References
External links
Related articles
Friedrich Huebler, 3 March 2008 (edited 8 February 2009), Creative Commons License
Permanent URL: http://huebler.blogspot.com/2008/03/global-population-of-primary-school-age.html

Sunday, February 24, 2008

UNICEF releases new MICS survey data

UNICEF has released the first datasets from the third round of Multiple Indicator Cluster Surveys (MICS), conducted in 2005 and 2006. The first round of MICS surveys was carried out around 1995, followed by a second round of surveys around 2000.

MICS surveys are nationally representative household surveys that were developed by UNICEF in collaboration with other organizations to collect data on the situation of children and women. The most recent round of surveys collected data on household characteristics, education, child labor, water and sanitation, child mortality, maternal and newborn health, knowledge of HIV and AIDS, contraceptive use, birth registration, and other areas. The data can be used to track progress toward the UN Millennium Development Goals and other goals. The MICS program is described in detail on the Childinfo website of UNICEF.

In the area of education, the latest MICS surveys provide data for the following household member characteristics:
  • highest level of education
  • current school attendance
  • school attendance in the previous year
  • literacy
With the data it is possible to calculate primary and secondary school enrollment rates, repetition and dropout rates, survival rates, and other education statistics. The MICS surveys also allow detailed disaggregation of the data, for example by gender, area of residence, or household wealth. Examples for the kind of analysis that is possible with MICS data can be seen in previous articles on this site, for example on child labor and school attendance in Bolivia, educational attainment in India, or years of schooling and literacy.

The MICS datasets are available for download in SPSS format from the Childinfo website. The datasets are provided free of charge but interested researchers have to apply for a MICS username and password. At the time of writing, datasets from the following countries were available: Bangladesh, Belarus, Côte d'Ivoire, Cuba, Jamaica, Mongolia, Montenegro, Serbia, Sierra Leone, and Uzbekistan. In addition, survey questionnaires, survey reports, and a set of standard tabulations are provided. The questionnaires, tables, and reports can be downloaded without access restrictions.

External links
Related articles
Friedrich Huebler, 24 February 2008, Creative Commons License
Permanent URL: http://huebler.blogspot.com/2008/02/unicef-releases-new-mics-survey-data.html

Monday, February 11, 2008

Survival rate to the last grade of primary school

Since January 2008, the survival rate to the last grade of primary school is an official indicator to track progress toward the second UN Millennium Development Goal (MDG), which calls for universal primary education by the year 2015. The survival rate to the last grade is the percentage of a cohort of students who enter the first grade of primary education and who are expected to reach the last grade, regardless of repetition.

As an example, assume that primary school has four grades. Assume further that 100 children enter grade one and that 5 of these children drop out from school before they reach the last grade. The remaining 95 children reach grade four, with or without repeating one or more grades. In this case, the survival rate to the last grade is 95 / 100 = 95%.

As a previous article on this site explains, the survival rate to grade five was used an official indicator for MDG 2 until 2007. The survival rate to the last grade is a better indicator because it can be calculated for countries with fewer than five grades of primary school and because it is more in line with the goal of universal primary education.

The map below shows the most recent statistics on the survival rate to the last grade from the UNESCO Institute for Statistics (UIS). In most cases, the statistics are from the year 2005. The next revision of the UIS database, expected in mid-2008, will contain survival rates for 2006.

Survival rate to the last grade of primary school, 2005
Map of the world showing national survival rates to the last grade of primary school, 2005
Data source: UNESCO Institute for Statistics, Data Centre, January 2008.

The current UIS database lists the survival rate to the last grade for 154 countries. The values range from 25% in Nauru and Uganda to 100% in Croatia, Cyprus, Iceland, Israel, Italy, Norway, Spain, and Tajikistan. In addition to Nauru and Uganda, nine other countries have survival rates below 50%: Chad (26%), Rwanda (31%), Equatorial Guinea (33%), Malawi (34%), Mauritania (39%), Madagascar (43%), Turks and Caicos Islands (45%), and Benin and Mozambique (46%). In these eleven countries, more than half of all children who start attending primary school drop out before they reach the last grade.

Ten countries have survival rates in the range 50-60%, 20 each are in the range 60-70% and 70-80%, 26 countries have survival rates from 80% to 90%, and in 67 countries 90% or more of all primary school entrants reach the last grade. As the map shows, almost all countries with survival rates below 60% are located in Sub-Saharan Africa.

The following table compares average survival rates in the different MDG regions. In the group of developed countries, in the countries from the Commonwealth of Independent States (former Soviet Republics), and in Eastern Asia, almost all children reach the last grade of primary school. In contrast, fewer than two thirds of all first grade students in Sub-Saharan Africa reach the last grade. Survival rates are also relatively low in Northern Africa and Oceania (78%), and in Southern and South-Eastern Asia (84%). In Western Asia and Latin America, around 90% of all first grade students reach the last grade.

Survival rate to the last grade of primary school, 2005
MDG region Survival rate to last grade (%)
Male FemaleTotal
Developed countries 99.199.299.2
Commonwealth of Independent States99.699.099.4
Eastern Asia98.998.898.8
South-Eastern Asia84.584.384.4
Oceania78.478.278.3
Southern Asia84.583.083.8
Western Asia88.786.988.0
Northern Africa75.381.878.3
Sub-Saharan Africa64.363.163.9
Latin America and the Caribbean90.590.190.4
World85.184.584.9
Data source: UNESCO Institute for Statistics, Data Centre, January 2008.

The average survival rate to the last grade at the global level is 85%, with virtually no difference between boys and girls. However, gender disparities exist in some regions, in particular in Northern Africa, were girls, with an average survival rate of 82%, are more likely to continue their education to the last grade of primary school than boys, whose survival rate is 75%.

Related articles
External links
Friedrich Huebler, 11 February 2008, Creative Commons License
Permanent URL: http://huebler.blogspot.com/2008/02/survival-rate-to-last-grade-of-primary.html

Monday, February 4, 2008

Official MDG targets and indicators

Progress toward the UN Millennium Development Goals is monitored with an official list of MDG indicators. These indicators are endorsed by the Inter-Agency and Expert Group (IAEG) on MDG Indicators, whose work is coordinated by the United Nations Statistics Division. At its last meeting in November 2007, the IAEG agreed on a revised set of MDG indicators that will be used for the next global assessment of progress in 2008. In the area of education, the following goals and indicators are now in effect.

Millennium Development Goals and indicators related to education
Goals and targets Indicators for monitoring progress
Goal 2: Achieve universal primary education
Target 2.A: Ensure that, by 2015, children everywhere, boys and girls alike, will be able to complete a full course of primary schooling. 2.1 Net enrolment ratio in primary education.
2.2 Proportion of pupils starting grade 1 who reach last grade of primary.
2.3 Literacy rate of 15-24 year-olds, women and men.
Goal 3: Promote gender equality and empower women
Target 3.A: Eliminate gender disparity in primary and secondary education, preferably by 2005, and in all levels of education no later than 2015. 3.1 Ratios of girls to boys in primary, secondary and tertiary education.
Goal 6: Combat HIV/AIDS, malaria and other diseases
Target 6.A: Have halted by 2015 and begun to reverse the spread of
HIV/AIDS.
6.4 Ratio of school attendance of orphans to school attendance of non-orphans aged 10-14 years.

Most of these indicators are unchanged, with one exception. The survival rate to the last grade of primary school (indicator 2.2) replaces the survival rate to grade 5 of primary school that was previously used as one of the indicators for MDG 2, universal primary education by 2015. The survival rate to the last grade is a better indicator for this goal than the survival rate to grade 5. First, the survival rate to grade 5 is not relevant in countries where primary school has only four grades and for such countries the UNESCO Institute for Statistics does not provide estimates for this indicator. Second, the survival rate to grade 5 offers no information on continued school attendance in countries where primary school has more than five grades. Estimates of the survival rate to grade 5 can therefore provide an incomplete picture of progress toward universal primary education. In contrast, the survival rate to the last grade can be used in all countries, regardless of the official duration of primary school.

The complete list of indicators is available at the official UN site for the MDG indicators.

External links
Related articles
Friedrich Huebler, 4 February 2008 (edited 17 October 2008), Creative Commons License
Permanent URL: http://huebler.blogspot.com/2008/02/official-mdg-targets-and-indicators.html