- Primary net intake rate (NIR), the share of children who enter school at the official school entrance age. Calculation method: Primary NIR = number of new entrants to the first grade of primary school who are of official primary school entrance age / total number of children of official primary school entrance age.
- Primary net enrollment rate (NER), the share of children of official primary school age who are enrolled in primary school. Calculation method: Primary NER = number of children of official primary school age who are enrolled in primary school / total number of children of official primary school age.
- Secondary net enrollment rate (NER), the share of children of official secondary school age who are enrolled in secondary school. Calculation method: Secondary NER = number of children of official secondary school age who are enrolled in secondary school / total number of children of official secondary school age.
- Survival rate to grade 5: The share of children enrolled in the first grade of primary school who eventually reach the fifth grade, regardless of grade repetition. Calculation method: Survival rate to grade 5 = number of children reaching grade 5 / number of children enrolled in grade 1.
Global trends in primary and secondary education, 2000-2004
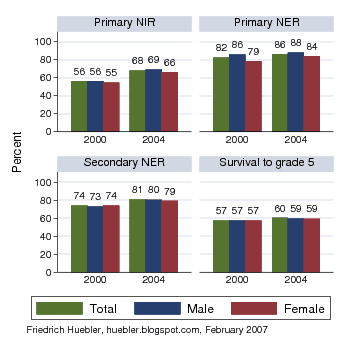
Data source: UNESCO global education database, October 2006. - Note: Male and female survival rates are available for fewer countries than the total survival rate.
The biggest increases were observed for the primary net intake rate and the secondary net enrollment rate. The primary net intake rate increased from 56.3 to 67.8 percent, but fewer girls than boys enroll in school at the official school age. For boys, the primary net intake rate in 2004 is 68.9 percent, compared to 66.4 percent for girls. The secondary net enrollment rate grew from 73.7 to 80.7 percent. As with the net intake rate, the increase for boys exceeded that for girls but the disparity between boys' and girls' secondary enrollment rates is only 1.2 percent.
Among the indicators listed here, the primary school net enrollment rate has the highest values. Between 2000 and 2004, the primary NER increased from 82.5 to 86.4 percent. Possibly due to increased efforts to enroll girls in school, the primary NER of girls grew by 5.6 percentage points over the four-year period, compared to 2.5 percentage points for boys. As a result, the gap between the male and female primary NER fell from 7 percent in 2000 to 4 percent in 2004.
The survival rate to grade 5 showed the smallest improvement between 2000 and 2004. For all children combined, this indicator grew from 57.4 to 60.1 percent. In contrast to the other three indicators, there is no gender disparity in the survival rate to grade 5. Both boys and girls have the same probability of advancing to the fifth grade. (Note that gender disaggregated values are available for a smaller number of countries than the total survival rate. This explains why both the male and female survival rate are below the total survival rate. If data on the survival rate to grade 5 were available for all countries, the total value would lie between the male and female values.)
Global trends in primary and secondary education, 2000-2004
| Indicator | 2000 | 2004 | Change 2000-2004 |
| Primary net intake rate (%), total | 56.3 | 67.8 | 11.6 |
| Primary net intake rate (%), male | 56.2 | 68.9 | 12.7 |
| Primary net intake rate (%), female | 54.5 | 66.4 | 11.9 |
| Primary net enrollment rate (%), total | 82.5 | 86.4 | 3.9 |
| Primary net enrollment rate (%), male | 85.6 | 88.1 | 2.5 |
| Primary net enrollment rate (%), female | 78.6 | 84.1 | 5.6 |
| Secondary net enrollment rate (%), total | 73.7 | 80.7 | 7.0 |
| Secondary net enrollment rate (%), male | 72.5 | 80.2 | 7.6 |
| Secondary net enrollment rate (%), female | 73.6 | 79.0 | 5.4 |
| Survival rate to grade 5 (%), total | 57.4 | 60.1 | 2.7 |
| Survival rate to grade 5 (%), male | 57.3 | 59.2 | 1.9 |
| Survival rate to grade 5 (%), female | 57.1 | 59.1 | 2.0 |
Edit 10 March 2007: Some countries were added to the calculations and as a result the global values changed.
Related articles
- Official school ages: primary, secondary, and compulsory education
- Primary school enrollment in 2004
- Secondary school enrollment in 2002/03
- United Nations Millennium Development Goals
- UNESCO global education database
- UNESCO Institute for Statistics
Permanent URL: http://huebler.blogspot.com/2007/02/global-trends-in-primary-and-secondary.html
 On 11 December 2006, UNICEF released the 2007 edition of its annual publication
 On 26 October 2006, UNESCO released the 2007 edition of the