All articles on my blog on education statistics are now labeled with keywords. This feature was introduced with a new version of Blogger, launched on 19 December 2006. Clicking on a label leads to a page containing all posts with the particular label (example: all posts labeled "India"). In addition, I continue to use del.icio.us tags for all posts on the blog, as described in my article on blog categories. I also added the backlinks feature of Blogger that provides a list of links to an article.
Links:
Friedrich Huebler, 1 January 2007 (edited 27 January 2007), Creative Commons License
Permanent URL: http://huebler.blogspot.com/2007/01/new-blog-feature-subject-labels.html
Monday, January 1, 2007
Sunday, December 24, 2006
"The State of the World's Children 2007" by UNICEF: Gender disparity in primary and secondary school
 On 11 December 2006, UNICEF released the 2007 edition of its annual publication The State of the World's Children. This year's report, with the title Women and children: The double dividend of gender equality, looks at the status of women today and discusses how gender equality can help achieve the UN Millennium Development Goals.
The report argues that gender equality produces a double dividend because it benefits both women and children. Healthy, educated and empowered women have healthy, educated and confident children. Through gender equality women can not only live full and productive lives, they can also improve the lives of their children, their families, and the society they are part of.
The State of the World's Children contains detailed statistical tables with data on health, nutrition, HIV/AIDS, education, demographics, economy, women, and child protection for each country. In the area of education, the report lists data for the following indicators:
- Literacy
- Primary school enrollment and attendance
- Secondary school enrollment and attendance
- Survival rate to grade 5
- Primary school gross enrollment rate (GER) = Number of children enrolled in primary school / Number of children of official primary school age
- Female GER as a percent of male GER = 100 * (Female GER / Male GER)
Note that the reported values contain no information about the absolute level of school enrollment. It is possible to have gender parity at very low enrollment levels. Take a country where 50 percent of boys and 50 percent of girls attend primary school. Although the country would be far from the Millennium Development Goal of universal primary education, there would be gender parity in primary school. For data on absolute enrollment levels refer to an earlier post on primary school enrollment in 2004, with the most recent data from the UNESCO Institute for Statistics.
Primary and secondary school gross enrollment ratios: female GER as a percent of male GER, 2000-2005
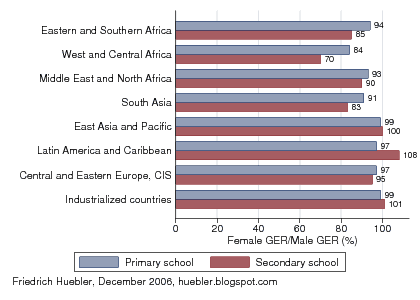
Data source: UNICEF. 2006. The state of the world's children 2007: Women and children - The double dividend of gender equality. New York: UNICEF. Table 8, page 133.
According to the data reported by UNICEF, only two regions have achieved gender parity in both primary and secondary school: East Asia and the Pacific, and the industrialized countries. The countries of Central and Eastern Europe and the Commonwealth of Independent States (CIS) are close to gender parity, with female enrollment rates at 95 to 97 percent of male enrollment rates. Latin America and the Caribbean are close to gender parity in primary school but in secondary school, the female GER far exceeds the male GER (gender parity index 108 percent), which means that more girls than boys continue their education past primary school.
In the Middle East and North Africa, the female GER is at 93 percent of the male GER in primary school and at 90 percent in secondary school. In the three remaining regions, there is a larger drop in the gender parity index from primary to secondary school. In Eastern and Southern Africa, almost as many girls as boys are enrolled in primary school (gender parity index 94 percent) but at the secondary level of education, the female GER is only 85 percent of the male GER. In South Asia, the gender parity index is 91 percent in primary school and 83 percent in secondary school.
In West and Central Africa, girls are furthest behind boys in terms of school enrollment. The gender parity index is 84 percent in primary school and 70 percent in secondary school. In addition, total enrollment rates are lower than in any other region of the world (see primary school enrollment in 2004 and primary school enrollment in 2002/03). Compared to boys and compared to girls in other region, girls from West and Central Africa are least likely to reap the benefits of a formal school education.
External links
- The State of the World's Children 2007 web site
- Download The State of the World's Children 2007 (PDF, 1.8 MB)
- UN Millennium Development Goals
- Primary school enrollment in 2004
- Primary school enrollment in 2002/03
- Trends in primary school enrollment, 1970-2004
- Primary school gross and net enrollment
Permanent URL: http://huebler.blogspot.com/2006/12/state-of-worlds-children-2007-by-unicef.html
Thursday, December 7, 2006
Years of schooling and literacy, part 2
The Education for All Global Monitoring Report 2007 assesses individual countries' progress toward the goal of basic education for all children and adults by 2015 with the EFA Development Index (EDI). One component of the EDI is the adult literacy rate. In countries where the adult literacy rate is not available, the EDI is calculated with a proxy measure: the share of the adult population with at least a complete primary education (UNESCO 2006, p. 201, note 2).
A previous article on this site, "Years of schooling and literacy: Can everyone with primary education read and write?", analyzed data on years of schooling and literacy from 26 household surveys in Sub-Saharan Africa. The results showed that most persons who graduated from primary school or attended higher levels of education can indeed be considered literate and that the share of the adult population with at least a complete primary education is therefore a suitable proxy for the adult literacy rate.
The present article extends the analysis from Sub-Saharan Africa to 19 additional countries from Latin America, North Africa, Asia, and Eastern Europe. The data, collected between 1998 and 2004, is from 15 Multiple Indicator Cluster Surveys (MICS) funded by UNICEF, and 4 Demographic and Health Surveys (DHS) funded by the United States Agency for International Development (USAID). The surveys and data collection methods are described in detail in the previous article with literacy data from Sub-Saharan Africa.
For the analysis that follows, household members in each survey dataset were divided into 13 groups according to the highest grade of formal education completed: no formal education, grade 1 completed, grade 2 completed, ..., grade 11 completed, and grade 12 or higher completed. Within each group, the share of literate persons was calculated. The results are plotted in the graphs below.
For the presentation of the results, countries are grouped according to the geographic regions used by UNICEF. The first graph shows data from 5 countries in Latin America and the Caribbean. For each country, a line indicates how the percentage of literate persons varies with the completed years of formal education. In Suriname, for example (the orange line in the graph), 17 percent of all persons without formal education are literate, compared to 46 percent of those who completed the first grade, 67 percent of those who completed the second grade, and so on. The number in parentheses behind the name of each country indicates the official length of primary education in years. For example, primary school has six grades in Bolivia and eight grades in the Dominican Republic.
The available data for Latin American and the Caribbean shows that the education systems in this region perform very well in terms of literacy. Literacy rates increase steadily with increasing years of education and by the time children complete primary school, close to 100 percent can read and write.
Years of education and literacy in Latin America and the Caribbean
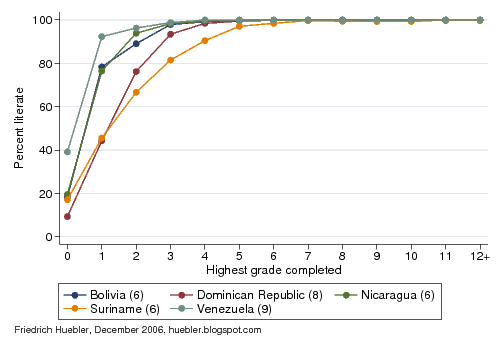
Data source: 3 DHS and 2 MICS surveys, 1999-2004. - Number after country name indicates official duration of primary education.
The second graphs shows data from 6 countries in Central and Eastern Europe and the Commonwealth of Independent States. In contrast to Latin America and the Caribbean, completion of primary school does not guarantee literacy. In Tajikistan, only 87 percent of those with complete primary education can be considered literate. In Azerbaijan and Moldova, literacy rates are 93 to 94 percent after graduation from the last grade of primary school. The low literacy rate among persons with four years of education in Uzbekistan is an outlier caused by a skewed age distribution. This group includes a high share of persons above 60 years of age who left school after completing primary school and who have relatively low literacy levels compared to other groups. In all countries literacy levels are near 100 percent once a person has 8 or more years of education.
Years of education and literacy in Central and Eastern Europe and the Commonwealth of Independent States
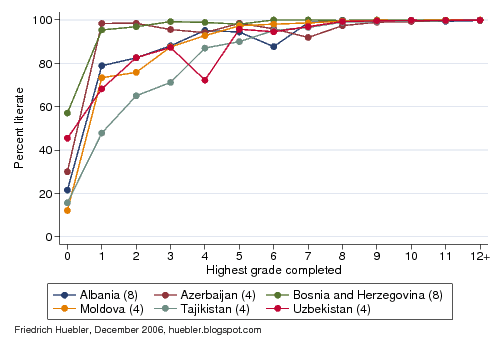
Data source: 6 MICS surveys, 2000. - Number after country name indicates official duration of primary education.
The last graph combines 8 countries from 3 UNICEF regions: the Middle East and North Africa, South Asia, and East Asia. The results are similar to those for Latin America and the Caribbean. Virtually all children who graduate from primary school can read and write. Even in Iraq, the country with the slowest increase in literacy rates according to the highest grade completed, 99 percent of primary school graduates could read and write (the data for Iraq was collected in 2000, before the current war).
Years of education and literacy in East Asia, South Asia, and the Middle East and North Africa
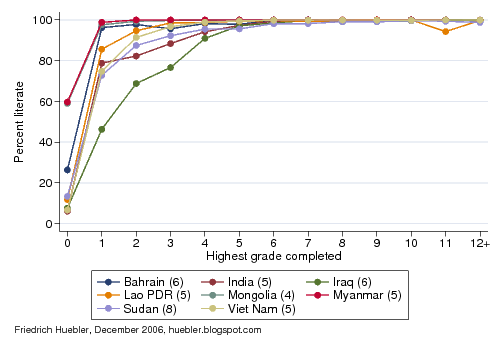
Data source: 1 DHS and 7 MICS surveys, 1998-2003. - Number after country name indicates official duration of primary education.
To summarize, in most countries completion of primary school provides students with the necessary reading and writing skills. There are exceptions, especially in some former states of the Soviet Union (see above) and in parts of West and Central Africa (see the previous article), where additional years of education are needed to guarantee literacy. In spite of these limitations, the share of the population with at least a complete primary education can be considered a good indicator for the adult literacy rate.
References
Permanent URL: http://huebler.blogspot.com/2006/12/years-of-schooling-and-literacy-part-2.html
A previous article on this site, "Years of schooling and literacy: Can everyone with primary education read and write?", analyzed data on years of schooling and literacy from 26 household surveys in Sub-Saharan Africa. The results showed that most persons who graduated from primary school or attended higher levels of education can indeed be considered literate and that the share of the adult population with at least a complete primary education is therefore a suitable proxy for the adult literacy rate.
The present article extends the analysis from Sub-Saharan Africa to 19 additional countries from Latin America, North Africa, Asia, and Eastern Europe. The data, collected between 1998 and 2004, is from 15 Multiple Indicator Cluster Surveys (MICS) funded by UNICEF, and 4 Demographic and Health Surveys (DHS) funded by the United States Agency for International Development (USAID). The surveys and data collection methods are described in detail in the previous article with literacy data from Sub-Saharan Africa.
For the analysis that follows, household members in each survey dataset were divided into 13 groups according to the highest grade of formal education completed: no formal education, grade 1 completed, grade 2 completed, ..., grade 11 completed, and grade 12 or higher completed. Within each group, the share of literate persons was calculated. The results are plotted in the graphs below.
For the presentation of the results, countries are grouped according to the geographic regions used by UNICEF. The first graph shows data from 5 countries in Latin America and the Caribbean. For each country, a line indicates how the percentage of literate persons varies with the completed years of formal education. In Suriname, for example (the orange line in the graph), 17 percent of all persons without formal education are literate, compared to 46 percent of those who completed the first grade, 67 percent of those who completed the second grade, and so on. The number in parentheses behind the name of each country indicates the official length of primary education in years. For example, primary school has six grades in Bolivia and eight grades in the Dominican Republic.
The available data for Latin American and the Caribbean shows that the education systems in this region perform very well in terms of literacy. Literacy rates increase steadily with increasing years of education and by the time children complete primary school, close to 100 percent can read and write.
Years of education and literacy in Latin America and the Caribbean

Data source: 3 DHS and 2 MICS surveys, 1999-2004. - Number after country name indicates official duration of primary education.
The second graphs shows data from 6 countries in Central and Eastern Europe and the Commonwealth of Independent States. In contrast to Latin America and the Caribbean, completion of primary school does not guarantee literacy. In Tajikistan, only 87 percent of those with complete primary education can be considered literate. In Azerbaijan and Moldova, literacy rates are 93 to 94 percent after graduation from the last grade of primary school. The low literacy rate among persons with four years of education in Uzbekistan is an outlier caused by a skewed age distribution. This group includes a high share of persons above 60 years of age who left school after completing primary school and who have relatively low literacy levels compared to other groups. In all countries literacy levels are near 100 percent once a person has 8 or more years of education.
Years of education and literacy in Central and Eastern Europe and the Commonwealth of Independent States

Data source: 6 MICS surveys, 2000. - Number after country name indicates official duration of primary education.
The last graph combines 8 countries from 3 UNICEF regions: the Middle East and North Africa, South Asia, and East Asia. The results are similar to those for Latin America and the Caribbean. Virtually all children who graduate from primary school can read and write. Even in Iraq, the country with the slowest increase in literacy rates according to the highest grade completed, 99 percent of primary school graduates could read and write (the data for Iraq was collected in 2000, before the current war).
Years of education and literacy in East Asia, South Asia, and the Middle East and North Africa

Data source: 1 DHS and 7 MICS surveys, 1998-2003. - Number after country name indicates official duration of primary education.
To summarize, in most countries completion of primary school provides students with the necessary reading and writing skills. There are exceptions, especially in some former states of the Soviet Union (see above) and in parts of West and Central Africa (see the previous article), where additional years of education are needed to guarantee literacy. In spite of these limitations, the share of the population with at least a complete primary education can be considered a good indicator for the adult literacy rate.
References
- UNESCO. 2006. Education for All Global Monitoring Report 2007: Strong foundations - Early childhood care and education. Paris: UNESCO.
- Years of schooling and literacy: Can everyone with primary education read and write?
- EFA Development Index: Assessing progress toward Education for All
- Education data from household surveys
- Millennium Development Goal regions and UNICEF regions
- Multiple Indicator Cluster Surveys
- Demographic and Health Surveys
- Education for All Global Monitoring Report 2007
Permanent URL: http://huebler.blogspot.com/2006/12/years-of-schooling-and-literacy-part-2.html
Sunday, November 26, 2006
Years of schooling and literacy: Can everyone with primary education read and write?
The 2007 edition of the Education for All Global Monitoring Report was released by UNESCO in October 2006. The report assesses progress toward the goal of basic education for all children and adults by 2015 with the EFA Development Index (EDI). A previous article on this site describes how the EDI is calculated.
One component of the EDI is the adult literacy rate. The adult literacy rate usually indicates the share of literate persons in the population aged 15 years and older. In countries, where the literacy rate is not available, a proxy measure is substituted for the calculation of the EDI. This proxy measure is the share of the adult population with at least a complete primary education (UNESCO 2006, p. 201, note 2).
To evaluate whether this proxy is indeed a good substitute for the adult literacy rate, it is necessary to know if all children with a complete primary education can in fact be considered literate. Various household surveys collect data on literacy, among them the Multiple Indicator Cluster Surveys (MICS) funded by UNICEF, and the Demographic and Health Surveys (DHS) funded by the United States Agency for International Development (USAID).
Previous MICS surveys collected data on literacy by asking household members aged 15 years and older if they can read a letter or newspaper easily, with difficulty, or not at all (UNICEF 2000, model questionnaire, p. Q.3). Previous DHS surveys asked if a person can read and write in any language without any difficulty (e.g., NSEO Eritrea and ORC Macro 2003, Appendix E, p. 263). More recent surveys, including the latest MICS surveys conducted in 2005 and 2006, use a more direct approach than self-assessment. Household members are shown a card with a simple sentence and are asked to read it. Example sentences are "The child is reading a book," "The rains came late this year," or "Farming is hard work" (UNICEF 2006, Appendix 2, p. A2.14).
This article examines data from 4 DHS and 22 MICS surveys in Sub-Saharan Africa that collected data on literacy with one of the methods described above. The 26 surveys were conducted between 1999 and 2004. In addition to literacy, the surveys also identified the highest level of education of each household member at least 5 or 6 years old. For the analysis, household members were divided into 13 groups according to the highest grade of formal education completed: no formal education, grade 1 completed, grade 2 completed, ..., grade 11 completed, and grade 12 or higher completed. Within each group, the share of literate persons was calculated. The results are plotted in the graphs below.
To reduce the number of countries in a graph, the countries were grouped according to the geographic regions used by UNICEF. The first graph shows 11 countries in Eastern and Southern Africa. For each country, a line indicates how the percentage of literate persons varies with the completed years of formal education. For example, in Kenya (the red line in the graph), 11 percent of all persons without formal education are literate, compared to 36 percent of those who completed the first grade, 49 percent of those who completed the second grade, and so on. The number in parentheses behind the name of each country indicates the official length of primary education in years. For example, primary school has four grades in Angola and six grades in Burundi.
The theory underlying the EFA Development Index assumes that all persons with a complete primary education are literate. The graph for Eastern and Southern Africa shows that this is mostly true. In Angola, Comoros, Somalia, and Swaziland, the literacy rate of persons who did not continue their education after completing primary school ranges from 95 to 97 percent and with additional years of education the literacy rate increases further. In Eritrea, Ethiopia, Kenya, Lesotho, Mozambique, and Rwanda, the literacy rate of persons with primary education only is 99 to 100 percent. Burundi is an exception; here, the literacy rate of persons with 6 years of education (the official length of primary school) is only 90 percent. Closer inspection of the data shows that this is due to relatively high illiteracy among the older population, who attended school more than 20 years ago. For persons with 7 or more years of education, the literacy rate approaches 100 percent in Burundi.
Years of education and literacy in Eastern and Southern Africa
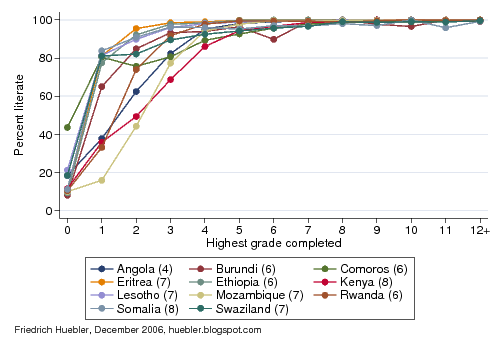
Data source: 3 DHS and 8 MICS surveys, 1999-2004. - Number after country name indicates official duration of primary education.
The second graph displays the link between years of schooling and literacy in 15 countries from West and Central Africa. A comparison of the two graphs reveals a striking difference between the two regions. In Eastern and Southern Africa, a literacy rate of more than 80 percent is reached after 4 years of education; after 5 years, at least 90 percent of the population are literate. In West and Central Africa, only 6 of 15 countries have at least 80 percent literacy after 4 years of education. A 90 percent literacy rate is only reached after 7 to 8 years of school, and in Gambia, 9 years are needed to reach the same goal.
Years of education and literacy in West and Central Africa
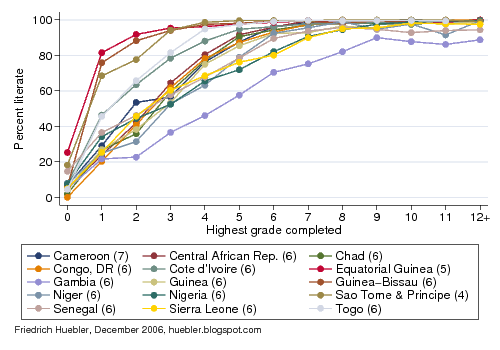
Data source: 1 DHS and 14 MICS surveys, 2000-2003. - Number after country name indicates official duration of primary education.
Overall, the literacy rates of persons with no more than primary education are much lower than in Eastern and Southern Africa. The lowest literacy rates among primary school graduates are observed in Gambia (71 percent), Sierra Leone (80 percent), and Nigeria (82 percent). In Chad, the Democratic Republic of Congo, Guinea, Niger, and Senegal, the literacy rate of persons with primary education only ranges from 90 to 94 percent. In the Central African Republic and Côte d'Ivoire, the literacy rate of primary school graduates is 96 percent; in Equatorial Guinea it is 98 percent; and in Cameroon, Guinea-Bissau, Sao Tome and Principe, and Togo, 99 percent of primary school graduates are literate.
The analysis of years of schooling and corresponding literacy rates underlines the relatively poor state of the education system in many parts of West and Central Africa. Compared to other regions, countries in West and Central Africa not only have the lowest school attendance or enrollment rates on average, children also take longer to learn basic skills like reading and writing.
Returning to the question asked at the beginning of this article, is the share of the adult population with at least a complete primary education a suitable proxy for the adult literacy rate? The evidence from Sub-Saharan Africa shows that this indicator is not perfect, especially in countries where schools struggle to provide a high-quality education for all students. Yet, in spite of these limitations, most persons who graduated from primary school or attended higher levels of education can be considered literate. The share of the population with at least a complete primary education is therefore a good substitute for the adult literacy rate.
Correction, 7 December 2006: An earlier version of this article included data for Madagascar. All references to Madagascar were removed because the Madagascar 2000 MICS, on which the analysis was based, only provides data on education for persons up to 17 years of age. The literacy data is therefore not representative for the entire population of Madagascar.
References
Permanent URL: http://huebler.blogspot.com/2006/11/years-of-schooling-and-literacy-can.html
One component of the EDI is the adult literacy rate. The adult literacy rate usually indicates the share of literate persons in the population aged 15 years and older. In countries, where the literacy rate is not available, a proxy measure is substituted for the calculation of the EDI. This proxy measure is the share of the adult population with at least a complete primary education (UNESCO 2006, p. 201, note 2).
To evaluate whether this proxy is indeed a good substitute for the adult literacy rate, it is necessary to know if all children with a complete primary education can in fact be considered literate. Various household surveys collect data on literacy, among them the Multiple Indicator Cluster Surveys (MICS) funded by UNICEF, and the Demographic and Health Surveys (DHS) funded by the United States Agency for International Development (USAID).
Previous MICS surveys collected data on literacy by asking household members aged 15 years and older if they can read a letter or newspaper easily, with difficulty, or not at all (UNICEF 2000, model questionnaire, p. Q.3). Previous DHS surveys asked if a person can read and write in any language without any difficulty (e.g., NSEO Eritrea and ORC Macro 2003, Appendix E, p. 263). More recent surveys, including the latest MICS surveys conducted in 2005 and 2006, use a more direct approach than self-assessment. Household members are shown a card with a simple sentence and are asked to read it. Example sentences are "The child is reading a book," "The rains came late this year," or "Farming is hard work" (UNICEF 2006, Appendix 2, p. A2.14).
This article examines data from 4 DHS and 22 MICS surveys in Sub-Saharan Africa that collected data on literacy with one of the methods described above. The 26 surveys were conducted between 1999 and 2004. In addition to literacy, the surveys also identified the highest level of education of each household member at least 5 or 6 years old. For the analysis, household members were divided into 13 groups according to the highest grade of formal education completed: no formal education, grade 1 completed, grade 2 completed, ..., grade 11 completed, and grade 12 or higher completed. Within each group, the share of literate persons was calculated. The results are plotted in the graphs below.
To reduce the number of countries in a graph, the countries were grouped according to the geographic regions used by UNICEF. The first graph shows 11 countries in Eastern and Southern Africa. For each country, a line indicates how the percentage of literate persons varies with the completed years of formal education. For example, in Kenya (the red line in the graph), 11 percent of all persons without formal education are literate, compared to 36 percent of those who completed the first grade, 49 percent of those who completed the second grade, and so on. The number in parentheses behind the name of each country indicates the official length of primary education in years. For example, primary school has four grades in Angola and six grades in Burundi.
The theory underlying the EFA Development Index assumes that all persons with a complete primary education are literate. The graph for Eastern and Southern Africa shows that this is mostly true. In Angola, Comoros, Somalia, and Swaziland, the literacy rate of persons who did not continue their education after completing primary school ranges from 95 to 97 percent and with additional years of education the literacy rate increases further. In Eritrea, Ethiopia, Kenya, Lesotho, Mozambique, and Rwanda, the literacy rate of persons with primary education only is 99 to 100 percent. Burundi is an exception; here, the literacy rate of persons with 6 years of education (the official length of primary school) is only 90 percent. Closer inspection of the data shows that this is due to relatively high illiteracy among the older population, who attended school more than 20 years ago. For persons with 7 or more years of education, the literacy rate approaches 100 percent in Burundi.
Years of education and literacy in Eastern and Southern Africa

Data source: 3 DHS and 8 MICS surveys, 1999-2004. - Number after country name indicates official duration of primary education.
The second graph displays the link between years of schooling and literacy in 15 countries from West and Central Africa. A comparison of the two graphs reveals a striking difference between the two regions. In Eastern and Southern Africa, a literacy rate of more than 80 percent is reached after 4 years of education; after 5 years, at least 90 percent of the population are literate. In West and Central Africa, only 6 of 15 countries have at least 80 percent literacy after 4 years of education. A 90 percent literacy rate is only reached after 7 to 8 years of school, and in Gambia, 9 years are needed to reach the same goal.
Years of education and literacy in West and Central Africa

Data source: 1 DHS and 14 MICS surveys, 2000-2003. - Number after country name indicates official duration of primary education.
Overall, the literacy rates of persons with no more than primary education are much lower than in Eastern and Southern Africa. The lowest literacy rates among primary school graduates are observed in Gambia (71 percent), Sierra Leone (80 percent), and Nigeria (82 percent). In Chad, the Democratic Republic of Congo, Guinea, Niger, and Senegal, the literacy rate of persons with primary education only ranges from 90 to 94 percent. In the Central African Republic and Côte d'Ivoire, the literacy rate of primary school graduates is 96 percent; in Equatorial Guinea it is 98 percent; and in Cameroon, Guinea-Bissau, Sao Tome and Principe, and Togo, 99 percent of primary school graduates are literate.
The analysis of years of schooling and corresponding literacy rates underlines the relatively poor state of the education system in many parts of West and Central Africa. Compared to other regions, countries in West and Central Africa not only have the lowest school attendance or enrollment rates on average, children also take longer to learn basic skills like reading and writing.
Returning to the question asked at the beginning of this article, is the share of the adult population with at least a complete primary education a suitable proxy for the adult literacy rate? The evidence from Sub-Saharan Africa shows that this indicator is not perfect, especially in countries where schools struggle to provide a high-quality education for all students. Yet, in spite of these limitations, most persons who graduated from primary school or attended higher levels of education can be considered literate. The share of the population with at least a complete primary education is therefore a good substitute for the adult literacy rate.
Correction, 7 December 2006: An earlier version of this article included data for Madagascar. All references to Madagascar were removed because the Madagascar 2000 MICS, on which the analysis was based, only provides data on education for persons up to 17 years of age. The literacy data is therefore not representative for the entire population of Madagascar.
References
- National Statistics and Evaluation Office (NSEO) [Eritrea] and ORC Macro. 2003. Eritrea Demographic and Health Survey 2002. Calverton, Maryland: National Statistics and Evaluation Office and ORC
Macro. - UNESCO. 2006. Education for All Global Monitoring Report 2007: Strong foundations - Early childhood care and education. Paris: UNESCO.
- UNICEF. 2000. End-decade Multiple Indicator Cluster Survey manual: Monitoring progress toward the goals of the 1990 World Summit for Children. New York: UNICEF.
- UNICEF. 2006. Multiple Indicator Cluster Survey manual 2005: Monitoring the situation of children and women. New York: UNICEF.
- Years of schooling and literacy, part 2
- EFA Development Index: Assessing progress toward Education for All
- Education data from household surveys
- Primary school enrollment in 2004
- Millennium Development Goal regions and UNICEF regions
- Multiple Indicator Cluster Surveys
- Demographic and Health Surveys
- Education for All Global Monitoring Report 2007
Permanent URL: http://huebler.blogspot.com/2006/11/years-of-schooling-and-literacy-can.html
Tuesday, November 14, 2006
EFA Development Index: Assessing progress toward Education for All
 On 26 October 2006, UNESCO released the 2007 edition of the Education for All Global Monitoring Report. The annual EFA report assesses progress toward the goal of basic education for all children and adults by 2015. Individual countries are ranked with the EFA Development Index (EDI) that provides information for four of the six EFA goals:
- Universal primary education
- Adult literacy
- Gender parity
- Quality of education
- Early childhood care and education
- Learning needs of youth and adults
- Total primary net enrollment ratio (NER), the percentage of children of primary school age who are enrolled in primary or secondary school.
- Adult literacy rate. In countries without data on adult literacy, the share of the adult population with at least complete primary education is used as a proxy.
- Gender-specific EFA index (GEI). The GEI is a composite index that is calculated as the simple average of three gender parity indices (GPI):
- GPI for the gross enrolment ratio (GER) in primary education: GPI = female GER / male GER.
- GPI for the GER in secondary education: GPI = female GER / male GER.
- GPI for the adult literacy rate: GPI = female literacy rate / male literacy rate.
- If the calculation method for one of the three GPIs yields a value above 1 (because the female GER is greater than the male GER, or because the female literacy rate is greater than the male literacy rate), the calculation method is reversed. In such cases, the GPI is calculated as male GER / female GER, or as male literacy rate / female literacy rate.
- Survival rate to grade 5 as a proxy indicator for the quality of education. The survival rate to grade 5 is the share of children entering grade 1 of primary school who eventually reach grade 5, with or without repeating a grade.
- High EDI: 0.95 or more
- Medium EDI: 0.80 - 0.94
- Low EDI: less than 0.80
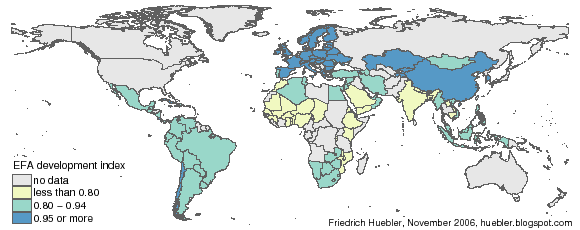
Data source: UNESCO. 2006. Education for All Global Monitoring Report 2007: Strong foundations - Early childhood care and education. Paris: UNESCO. Table 1, pages 200-201.
Of the 125 countries with data, 47 have a high EDI, which means they are close to or have already reached the goal of basic education for all children and adults. This group includes virtually all countries in Europe, as well as Armenia, Bahrain, Barbados, Chile, China, Costa Rica, Cuba, Fiji, Israel, Kazakhstan, Kyrgyzstan, Netherlands Antilles, Seychelles, South Korea, Tajikistan, and Trinidad and Tobago.
49 countries have a medium EDI between 0.80 and 0.94. This group includes most countries in Latin America and some countries in Africa and Asia.
Finally, 29 countries have a low EDI of less than 0.80. The twelve countries with the lowest EDI are all located in Sub-Saharan Africa. The lowest scoring countries are Chad (0.43), Niger (0.50), Burkina Faso (0.51), Mali (0.53), and Guinea (0.58). Countries with a low EDI outside of Africa include Bangladesh, Cambodia, Djibouti, India, Lao PDR, Nepal, and Saudi Arabia.
External links
- Education for All (EFA) goals
- EFA Global Monitoring Report web site
- Download the EFA Global Monitoring Report 2007 (PDF, 5.8 MB)
- Primary school enrollment in 2004
- Trends in primary school enrollment, 1970-2004
- Education disparity in South Asia
Permanent URL: http://huebler.blogspot.com/2006/11/efa-development-index-assessing.html
Friday, October 27, 2006
Final release of data from UNESCO's 2005 education survey
The UNESCO Institute for Statistics (UIS) has announced the final release of data from its 2005 education survey. The data, an update of the initial release from April 2006, can be downloaded from the UIS education database. I used the data to update two recent posts on primary school enrollment in 2004 and on trends in primary school enrollment from 1970 to 2004.
Friedrich Huebler, 27 October 2006, Creative Commons License
Friedrich Huebler, 27 October 2006, Creative Commons License
Thursday, September 28, 2006
Trends in primary school enrollment, 1970-2004
The latest data released by the UNESCO Institute for Statistics (UIS) shows that the world has come closer than ever to the goal of universal primary education. In 2004, the global primary school net enrollment rate (NER) was at 86%. This means that worldwide almost 9 out of 10 children of primary school age are enrolled in primary school. A comparison of national enrollment rates shows that many countries in Sub-Saharan Africa continue to lag behind countries in other regions.
With enrollment data from UNESCO for the years since 1970 it is possible to assess how much progress has been made over the past decades. The graph below compares the primary NER trends for boys and girls by Millennium Development Goal (MDG) region. For the graph, the MDG regions South-eastern Asia and Oceania were combined in one region, as were Northern Africa and Western Asia.
Primary school net enrollment rate (NER), 1970-2004
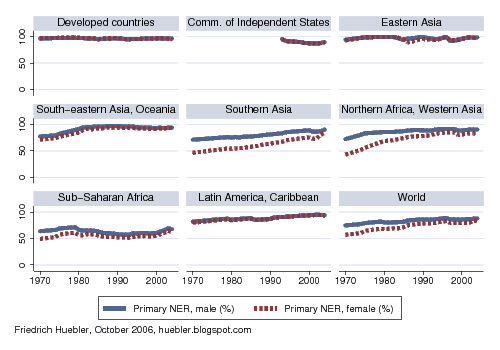
Data sources: (1) UNESCO Institute for Statistics, global education database, October 2006; (2) UNESCO Institute for Statistics, pre-1998 database, March 2005.
At the global level, shown in the lower right corner of the graph, there has been a steady increase in the primary NER of boys and girls since 1970. In addition, the gap between boys and girls has shrunk significantly. The male primary NER for 2004 is 88% and the female NER is 84%.
A comparison of regional trends shows clear differences in participation in primary education. In the developed countries, the primary school NER has been close to 100% for more than three decades. In Eastern Asia, enrollment rates were similarly high since 1970, with small up- and downturns. For the countries in the Commonwealth of Independent States, only post-Soviet data is available, showing a decline of the NER to about 90% in 2004. In South-eastern Asia and Oceania, the primary NER has been above 90% since the early 1980s. In Latin America and the Caribbean, gender parity in primary education has existed since 1970, and enrollment rates have increased steadily to an average primary NER of 94% in 2004.
Southern Asia, and Northern Africa and Western Asia stand out as regions where the education of girls has seen dramatic improvements. However, the primary NER of girls continues to be below that of boys, with a gender gap of about 6% in these regions. The enrollment rates of boys have also steadily increased over the past three decades. In 2004, the average primary NER for boys and girls combined was 87% in Southern Asia and 90% in Northern Africa and Western Asia.
Sub-Saharan Africa also witnessed a decrease in the gender gap since 1970 but overall enrollment rates stagnated below 60% throughout the 1980s and 1990s. Since 2000, there has been an improvement in primary school enrollment rates, due to renewed efforts to bring all children into school. By 2004, the primary NER of boys has risen to 70% and the NER of girls is at 65%.
Related articles
Friedrich Huebler, 28 September 2006 (edited 27 October 2006), Creative Commons License
Subscribe to:
Posts (Atom)