Sunday, December 28, 2008

Global Education Digest 2008

Cover of the Global Education Digest 2008The UNESCO Institute for Statistics (UIS) has announced the publication of the Global Education Digest 2008: Comparing Education Statistics Across the World. This annual publication contains detailed statistical tables with the latest UIS data on pre-primary, primary, secondary and tertiary education, education finance and literacy.

The introductory chapters in the this year's edition of the Digest discuss the data collection process at UIS, the International Standard Classification of Education (ISCED) and differences between national and international education data, the use of historical time series to track educational trends, and programs of cooperation between UIS and the Organisation for Economic Co-operation and Development (OECD) and the Statistical Office of the European Communities (Eurostat).

The Global Education Digest 2008 contains several tables that were not available in the 2007 edition. New tables with time series data provide statistics for more than 200 countries and territories from 1970, 1980, 1990, 2000 and 2005 for the following indicators: primary and secondary school age; population of secondary school age (the population of primary school age is available at the UIS Data Centre, see below); enrollment in primary, secondary and post-secondary education; total enrollment from primary to tertiary education; primary and secondary school gross enrollment ratio (GER); primary school gross intake ratio; gross intake ratio to the last grade of primary school (a proxy indicator for the primary completion rate); repetition rate in primary and secondary school; school life expectancy (primary to secondary and primary to tertiary); pupil/teacher ratio in primary and secondary school; and public expenditure on education.

A further addition in the new publication is a set of tables with data for 62 UOE and WEI countries. UOE refers to a joint data collection program by UIS, OECD and Eurostat in high- and middle-income countries. WEI stands for World Education Indicators, a UIS program for middle-income countries. The participating countries are listed on pages 30 and 31 of the Global Education Digest 2008.

The data from the tables in the Global Education Digest can be downloaded from the UIS Data Centre (click on "Predefined Tables" and then "Education"). The time series data for the years 1970 to 2005 are available in Excel format in Tables 21 to 23. The population of primary school age between 1970 and 2005 is not shown in the printed report but included in Table 21. In addition, the Data Centre offers annual data for the years 1999 to 2008, while the Digest only shows data for one or two years, depending on the indicator.

References
  • UNESCO Institute for Statistics (UIS). 2008. Global education digest 2008: Comparing education statistics across the world. Montreal: UIS. (Download PDF, 7.3 MB)
  • UNESCO Institute for Statistics (UIS). 2007. Global education digest 2007: Comparing education statistics across the world. Montreal: UIS. (Download PDF, 3.7 MB)
External links
Related articles
Friedrich Huebler, 28 December 2008 (edited 31 July 2009), Creative Commons License
Permanent URL: http://huebler.blogspot.com/2008/12/ged.html

Saturday, December 20, 2008

Education and democracy

Democratic government and the level of education in a country tend to be highly correlated. Seymour Lipset described this link in his article "Some social requisites of democracy: Economic development and political legitimacy."
"Education presumably broadens man's outlook, enables him to understand the need for norms of tolerance, restrains him from adhering to extremist doctrines, and increases his capacity to make rational electoral choices. ... The higher one's education, the more likely one is to believe in democratic values and support democratic practices. ... If we cannot say that a 'high' level of education is a sufficient condition for democracy, the available evidence suggests that it comes close to being a necessary one." (Lipset 1959: 79-80)
The correlation between education and democracy can be demonstrated with data on the school life expectancy from the UNESCO Institute for Statistics (UIS) and the democracy index from the Economist Intelligence Unit (EIU).

The democracy index is based on five categories: electoral process and pluralism, civil liberties, the functioning of government, political participation, and political culture. The methodology is explained in the full report from the EIU. The EIU calculated the democracy index for 167 countries and territories and placed them within four types of regime, depending on the index score.
  1. Full democracies (score 8-10): 30 countries
  2. Flawed democracies (score 6-7.9): 50 countries
  3. Hybrid regimes (score 4-5.9): 36 countries
  4. Authoritarian regimes (score below 4): 51 countries
The school life expectancy, obtained from the UIS Data Centre, is the total number of years of schooling a child can expect to receive. For 9 of the 167 countries rated by the EIU no data on the school life expectancy were available: Bosnia and Herzegovina, Haiti, North Korea, Montenegro, Papua New Guinea, Saudia Arabia, Singapore, Taiwan, and Turkmenistan.

The values for the 158 countries with data are plotted in the graph below. The school life expectancy is plotted along the horizontal axis and the EIU democracy index along the vertical axis. All countries are identified with their ISO alpha-3 codes.

National school life expectancy and EIU democracy index
Scatter plot with school life expectancy and EIU democracy index
Data source: UNESCO Institute for Statistics, Economist Intelligence Unit.

The graph shows that increasing school life expectancy is generally associated with a higher EIU democracy index. The average school life expectancy is 16.1 years for full democracies, 12.8 years for flawed democracies, 9.8 years for hybrid regimes, and 9.6 years for authoritarian regimes.

Average school life expectancy by regime type
Regime type School life expectancy (years)
Full democracies 16.1
Flawed democracies 12.8
Hybrid regimes 9.8
Authoritarian regimes 9.6
Data source: UNESCO Institute for Statistics, Economist Intelligence Unit.

Among authoritarian regimes the school life expectancy has a wider spread than among the other three types of regime. Two countries with authoritarian regimes, Cuba (democracy index 3.5, school life expectancy 16.1 years) and Libya (democracy index 2.0, school life expectancy 16.5 years), match or exceed the average school life expectancy in full democracies.

In contrast, no full democracy except Costa Rica (democracy index 8.0, school life expectancy 11.7 years) has a school life expectancy below 13.5 years. This observation supports Lipset's argument that a high level of education is a necessary condition for democracy.

References
  • Lipset, Seymour Martin. 1959. Some social requisites of democracy: Economic development and political legitimacy. American Political Science Review 53 (1), March: 69-105.
  • Economist Intelligence Unit. 2008. The Economist Intelligence Unit's index of democracy 2008. October. (Download PDF, 536 KB)
Related articles
External links
Friedrich Huebler, 20 December 2008 (edited 21 December 2008), Creative Commons License
Permanent URL: http://huebler.blogspot.com/2008/12/democracy.html

2.6 billion minutes are spent on Facebook each day worldwide

"Average user has 100 friends on the site
2.6 billion minutes are spent on Facebook each day (worldwide)
More than 13 million users update their statuses at least once each day
More than 2.5 million users become fans of Pages each day
More than 700 million photos uploaded to the site each month
More than 4 million videos uploaded each month
More than 15 million pieces of content (web links, news stories, blog posts, notes, photos, etc.) shared each month
More than 2 million events created each month
More than 19 million active user groups exist on the site"
Source: Facebook Press Statistics, retreived 20th December 2008
Updated here

Tuesday, December 16, 2008

Barack Obama is the most followed twitter user

Barack Obama has nearly 150,000 twitter followers (although he hasn't updated since he won the Presidential election). His most recent tweet was
"We just made history. All of this happened because you gave your time, talent and passion. All of this happened because of you. Thanks" on 5th November.

The fastest rising twitter users are:
Rick Sanchez - 35,882 followers in 141 days
Stephen Fry - 32,671 followers in 154 days
Source: Twitterholic.com - data collected on 16th December 2008

Friday, December 12, 2008

In Helsinki 57% of public transport single tickets are paid by mobile

"In Helsinki, Finland 57% of public transport single tickets are paid by mobile. In Croatia over half of all parking is paid by mobile. In South Africa you can have your paycheck paid directly to the mobile phone account linked to your mobile banking account. In Soweto a barbershop has more than half of its customers paying by mobile. 20% of London’s congestion charge is paid by mobile. In Slovenia every vending machine, every McDonald’s restaurant, and every taxicab accepts payment by mobile phone. In Kenya the maximum limit of mobile-to-mobile money payments is set to 1 million U.S. dollars per single transaction. And in South Korea, all credit card companies enable their credit cards to the owners’ mobile phones by default, offering to send an optional old-fashioned plastic credit card to the customer’s home address for free."
Source: Figures quoted by Alan Moore on page 8 of his paper The Glittering Allure of the Mobile Society, November 2008

Thursday, December 11, 2008

YouTube was the top search result for 2008 in 11 major countries

YouTube was the top search result in Google for 11 major countries in 2008 - Austria, Finland, France, Hong Kong (OK, not a country), Italy, Malaysia, Mexico, Spain, Sweden, Switzerland, & Taiwan. This is 11, out of a total of 34 countries reported on by Google.
This shows two things - that YouTube is incredibly popular globally, and that people use search for navigational purposes - that is to find specific things that they already know (rather than type in a term like 'video site')
Source: Google Zeitgeist 2008

Wednesday, December 10, 2008

In Japan, mobile accounts for over 90% of all digital music revenue

"Digital recorded music sales grew by over 20% year-on-year in all our comparator countries except France and Italy. Mobile music downloads now account for over half of all recorded digital music revenue in France, Italy and Japan. In Japan, mobile accounts for over 90% of all digital music revenue, compared to 29% for the UK."
Source: Ofcom International Communications Market 2008, November 2008
(The whole report - over 300 pages - is available for free download here

Approximately 70 new iPhone apps are added every day

"There are, as of Monday, 10,215 applications in the app store. The store is adding about 70 or so new applications every day.
Of those apps, about 3,500 of them are games (games and entertainment categories). The average price is $3.13 with $0.99 being the most common price. Interesting how this has fallen over the past few months.
It would cost almost $32,000 to buy every single app in the app store, but you would only be able to install 148 of them at a time. The least popular category is Weather with only 52 apps thus far.
A the current pace, the iTunes App Store should hit 25,000 applications sometime around the 1 year anniversary of July 11, 2009."
Source: 148apps blog, 29th November 2008, pre-empting Apple's announcement of 10,000 applications

There are now over 10,000 individual apps for the iPhone

"Apple has announced catalog and download numbers for iPhone applications in the form of a full-page ad that ran in Friday's edition of The New York Times and The Wall Street Journal.
The ad, which can be seen after the page break, boasts that more than 300 million applications have been downloaded from a catalog that now tops 10,000 different apps."
Source: Apple, in an ad in the NYT and WSJ, cited by CNET, 5th December 2008

Tuesday, December 9, 2008

A SecondLife avatar has approximately the same carbon footprint as a Brazillian

"If there are on average between 10,000 and 15,000 avatars "living" in Second Life at any point, that means the world has a population of about 12,500. Supporting those 12,500 avatars requires 4,000 servers as well as the 12,500 PCs the avatars' physical alter egos are using. Conservatively, a PC consumes 120 watts and a server consumes 200 watts. Throw in another 50 watts per server for data-center air conditioning. So, on a daily basis, overall Second Life power consumption equals:

(4,000 x 250 x 24) + (12,500 x 120 x 24) = 60,000,000 watt-hours or 60,000 kilowatt-hours

Per capita, that's:

60,000 / 12,500 = 4.8 kWh

Which, annualized, gives us 1,752 kWh. So an avatar consumes 1,752 kWh per year. By comparison, the average human, on a worldwide basis, consumes 2,436 kWh per year. So there you have it: an avatar consumes a bit less energy than a real person, though they're in the same ballpark.
Now, if we limit the comparison to developed countries, where per-capita energy consumption is 7,702 kWh a year, the avatars appear considerably less energy hungry than the humans. But if we look at developing countries, where per-capita consumption is 1,015 kWh, we find that avatars burn through considerably more electricity than people do.
More narrowly still, the average citizen of Brazil consumes 1,884 kWh, which, given the fact that my avatar estimate was rough and conservative, means that your average Second Life avatar consumes about as much electricity as your average Brazilian."
Source: Nicholas Carr, 5th December 2006, on his blog Rough Type

Monday, December 8, 2008

EFA Global Monitoring Report 2009

Cover of the EFA Global Monitoring Report 2009UNESCO released the 2009 edition of the Education for All Global Monitoring Report 2009 on 25 November 2008. The title of this year's report is Overcoming inequality: Why governance matters.

The report emphasizes the responsibility of governments across the world to tackle persistent inequalities in education - linked to wealth, gender, ethnicity, area of residence, and other factors - that threaten the Millennium Development Goal of universal primary education. According to projections by UNESCO, at least 29 million children of primary school age will still be out of school in 2015. Many children who attend school fail to reach basic literacy and numeracy. A lack of education among disadvantaged groups contributes to persistent poverty, increased child mortality, and slower economic growth.

The EFA Global Monitoring Report 2009 and related material are available at the EFA website of UNESCO.

References
  • UNESCO. 2008. EFA Global Monitoring Report 2009 - Overcoming inequality: Why governance matters. Paris: UNESCO. (Download in PDF format, 9.2 MB)
External links
Related articles
Friedrich Huebler, 8 December 2008, Creative Commons License
Permanent URL: http://huebler.blogspot.com/2008/12/efa.html

Wednesday, December 3, 2008

13-25s make up over 30% of all UK mobile internet users

"The distribution of PC Internet users was found to be relatively equal across each of the age groups studied [Under 25s, 25-34s, 35-44s, 44-55s, 55+s], with approximately one-fifth of the total audience coming from each segment. Mobile Internet usage, on the other hand, skewed substantially younger, with under-25-year-olds accounting for 30 percent of all users. Indeed, this age group represented nearly 50 percent more users than the 45-54 year old (11 percent) and the 55+ year old age groups (10 percent) combined. Mobile Internet users age 35 and under accounted for well over half (56 percent) of total users.
One point of congruency occurred in the 35-44 year old age group, which accounted for a 23 percent share of total users in both the PC and mobile user-bases."
Source: comScore UK PC & Mobile Internet Usage Report, December 2008

Monday, December 1, 2008

7.3m Britons used the mobile internet in Q3 2008, up 25% on Q2

"From Q2 to Q3 2008, the number of Britons using mobile Internet increased by 25% (from 5.8 to 7.3 million) compared to 3% for PC-based Internet (34.3 to 35.3 million Britons).
The mobile Internet audience has a higher concentration of younger users than PC-based Internet; 25% of mobile Internet consumers are aged 15-24 compared to 16% for PC-based consumers. Whilst, 23% of the PC-based Internet population is 55+, only 12% of the mobile Internet audience is"
Source: Nielsen Online, 24th November 2008

91% of UK mobile owners keep the phone within 3 feet, 24x7

"- 91% of mobile owners keep the phone within 3 feet, 24x7
- Mobile is as addictive as smoking cigarettes. Removing mobile phones produces similar withdrawal pains as attempting to stop smoking.
- Text-and-driving is more dangerous than stoned or drunk driving.
63% of people are not willing to share their phone with our spouse.
- 1 in 3 partners snoop inside the phone, mostly when we're in the shower. 10% of people ended relationships after this.
- 1 in 4 British couples sleeps apart 1 night a week because of their partners addiction to Blackberry, phones, etc."
Source: Tom Hume, 17th November 2008, quoting figures reported by Tomi Ahonen at the Future of Mobile conference in London

178 million Europeans are online each week

"- 178 million Europeans are online each week
- Over half (55%) of internet users online everyday
- Time online by 25-34’s is driving digital growth in 2008
- Online research influences brand decisions for 41%
- Almost half (49%) of all broadband users are now wireless"
Source: The European Interactive Advertising Association (EIAA), 19th November 2008

Apple has sold 174.1m iPods

"To put that number into perspective, enough iPods have been sold to provide a personal 'Pod to every man, woman, and child in the United Kingdom, Australia, the Netherlands, Greece, Israel, Sweden, Austria, Chile, Denmark, Ireland, Switzerland, New Zealand, and Greenland. And you'd still have enough leftover to give one to each fan attending Super Bowl XLIII eight days after the Mac turns 25."
Source: RegisterHardware, 18th November 2008, citing Apple figures

Gears of War 2 generates 15m hours of online gameplay in a weekend

"The original Gears Of War game was a massive success for the Xbox 360 console and now the new instalment, Gears Of War 2 (GOW2), looks like it may be even bigger, racking up sales of 2m in its first weekend.
Not only does that make it one of the biggest ever openings on the console but it managed to smash the Xbox LIVE record for online activity too. More than 1.5 million people signed into Gears of War 2 during the weekend, racking up a total 15 million gameplay hours, setting a new record for concurrent LIVE players."
Source: Gizmodo, 12th November 2008

Facebook has 15m regular users via mobile phones

"People are hungry for interactive mobile features worldwide, and Facebook users are no exception. Usage of our mobile products has grown from 5 million to 15 million active users since the beginning of the year. We have expanded our mobile team and are continuing to make improvements every day."
Source: Facebook, 10th November 2008
Update - as at early January 2009 this had risen to 21m

The Apple iPhone was the best-selling phone in the US in Q3 2008

"According to The NPD Group, the leader in market research for the wireless industry, Apple’s iPhone 3G surpassed the Motorola RAZR as the leading handset purchased by adult consumers* in the U.S. in the third quarter (Q3) of 2008. RAZR had been ranked by NPD as the top-selling consumer handset for the past 12 quarters."
Source: NPD Group, 10th November 2008

The top 10 emerging markets will surpass the top 10 developed markets in terms of internet users in 2008

See chart 36 of the presentation
Source: IMF, ITU, Morgan Stanley Research, cited in Morgan Stanley Technology/Internet Trends, 5th November 2008

Number of users of Opera Mini mobile web browser has grown 311% in 12 months

"In October, Opera Mini was used by approximately 21 million users, a 10.6% month-on-month increase from September 2008 and more than 311% compared to October 2007"
Source, Opera, makers of the world's most popular mobile browser, November 2008

3bn photos have been posted to Flickr

This is the 3 billionth photo.
Source: Flickr, 3rd November 2008

The Apple iPhone outsold the Blackberry in Q3 2008

"6.9 million iPhone units were sold in the quarter, more than in all previous quarters combined. After just 15 months in the mobile phone business, Apple outsold RIM in the September quarter. 6.1 million BlackBerry handsets were sold. Measured by revenue, Apple is now the third largest mobile phone supplier, after Nokia and Samsung"
Source: Thomas Husson of Jupiter Research, 22nd October 2008, citing an Apple earnings statement

MySpace stream 40m songs in the first 7 days of MySpace Music

"MySpace’s Jamie Kantrowitz stated there had been in the US alone 40m streams in the first seven days after launch of MySpace Music, with 17-18 streams per person."
Source: Mark Mulligan of Jupiter, 10th October 2008, citing data given by MySpace at the Popkomm conference

XBox360 users buy 3.8m music tracks a month

"In a statement designed to highlight its self-appointed status as the "preferred stage" for music-based games "Guitar Hero" and "Rock Band," Microsoft released data showing gamers, on average, buy 3.8 million songs a month, for either game, and have bought more than 45 million tracks for both to date, across all installments of the respective franchises."
Source: Billboard, 20th October 2008, citing Microsoft

10bn photos have been uploaded to Facebook

"We recently hit a really cool milestone, our users have now uploaded over 10 billion photos to the site. Now, that’s a big number, but we actually store four image sizes for each uploaded photo, so that’s over 40 billion files.
To celebrate, we got a bunch of cupcakes and handed them out to our engineering and operations groups. One of our engineers calculated that if we had gotten one cupcake for each of our photos, and lined them up side by side, the line could reach halfway to the moon.
Here’s some other interesting recent stats on photos:
- 2-3 Terabytes of photos are being uploaded to the site every day
- We have just over one petabyte of photo storage
- We serve over 15 billion photo images per day
- Photo traffic now peaks at over 300,000 images served per second"
Source: Facebook, 15th October 2008

42% of American teens claim to be able to text blindfolded

"Teens say texting has critical advantages because it offers more options, including multitasking, speed, the option to avoid verbal communication, and because it is fun – in that order. With more than 1 billion text messages sent each day, it is no surprise that 42 percent of teens say they can even text blindfolded, the study revealed"
Source: Harris Interactive, 12th September 2008

In June 2008 Bloggers have been blogging for an average of 3 years

"Bloggers have been at it an average of three years and are collectively creating close to one million posts every day. Blogs have representation in top-10 web site lists across all key categories, and have become integral to the media ecosystem."
Source: State of the Blogosphere, Technorati, September 2008

US 13-29s send an average of 20 text messages a day each

"Members of Generation Y (ages 13 to 29) send an average of 20 text
messages daily, compared to just 2 for Generation X (30-43) and less than one
for Baby Boomers (44 to 64)"
Source: Knowledge Networks, 18th September 2008

Saturday, November 29, 2008

13 hours of video are uploaded to YouTube every minute

"Today, 13 hours of video are uploaded to YouTube every minute, and we believe the volume will continue to grow exponentially. Our goal is to allow every person on the planet to participate by making the upload process as simple as placing a phone call. This new video content will be available on any screen - in your living room, or on your device in your pocket. YouTube and other sites will bring together all the diverse media which matters to you, from videos of family and friends to news, music, sports, cooking and much, much more."
Source: YouTube founder Chad Hurley, posting on Google's blog, 16th September 2008

28% of US & Western European mobile subscribers have a 3G device

"After a slower start than Western Europe, the United States caught up in adoption of 3G mobile, with 28.4 percent of American mobile subscribers having 3G devices vs. the average of 28.3 percent among the five largest Western Europe states"
Source: MarketingVox, 8th September 2008, citing data from comScore

Approximately 0.2% of websites have a mobile version

"Overall there are around 0.2% of web domains that have a mobile version. (This is not a precise figure but a rough estimation based on the millions of domains I've crawled)"
Source: MobiForge, August 2008

88% of UK searches are 'navigational'

"We’ve just updated our data on navigational / branded search in the UK for our new research report, Managing Your Brand Online. During May 2008, 88% of searches for the top 2,000 search terms in the UK were branded in nature, up from 81% in 2007 and 66% in 2005.
A quick refresher on the methodology that was used: we carried out an analysis of the top 2,000 search terms in the UK over the same 12 week period ending in May during 2005, 2006, 2007 and 2008, categorizing them into branded / navigational terms (e.g. ‘bebo’, ‘ebay’, ‘bbc’ – i.e. searches where there was a clear intention to search for a brand or reach a particular website) and non-navigational terms (e.g. ‘flights to spain’, ‘free games’, etc.). As we’ve highlighted previously, this trend towards more navigational / branded search at the ‘head’ of search terms contrasts with more sophisticated generic search behaviour in the long tail."
Source: Hitwise, 14th August 2008

NBC's online coverage of the Beijing Opening Ceremony was 10x more popular than their coverage of the Athens ceremony

"NBCOlympics.com garnered 70 million page views on 8/8/08, an increase of 900 percent and 10 times more than the opening day of the Athens Games in 2004 (7 million).
The 70 million page views are nearly 50 million more page views than the peak day in Athens (Day 4, 20.6 million).
NBCOlympics.com’s 4.2 million unique users show an increase of 496% over the unique users for the opening day of the Athens Games in 2004 (705,000).
Since August 1, 2008, NBCOlympics.com has accumulated more than 127 million page views, nearly half the TOTAL for the entire Athens Games
Source: LostRemote.com, 9th August 2008, citing data from NBC

There were 253m Chinese online by the end of June 2008

"By the end of June 2008, the amount of netizens in China had reached 253 million, surpassing that in the United States to be the first place in the world. This is according to a newly released Suvery Report by China Internet Network Information Center (CNNIC).
This report, the 22nd Statistical Report on the Internet Development in China, also indicates the number of broadband users has reached 214 million, which also tops the world. The CNNIC also announced that, by the time of July 22, the number of CN domain names, which was 12.18 million, had exceeded .de, the country-code Top Level Domain for Germany, thus becoming the largest country code Top-Level Domain names in the world. These three major breakthroughs show a big Internet power is taking shape."
Source: CNNIC, 31st July 2008

More tweens in the US spend and hour a day online than with any other medium

"Tweens consume information through many channels, but the Internet leads. When asked how much time they spent with various media types, 83% said they spend at least an hour per day online, and 68% reported at least an hour per day watching TV. Radio, magazines and newspapers came in much lower with 29%, 10% and five percent indicating they spent an hour per day with these channels.
Nearly half of respondents go online many times per day (more than three), and 87% usually spend at least a half hour each time."
Source, ChiefMarketer, 29th July 2008, citing data from Doubleclick Performics

Over 28m people in India aged 15+ accessed the internet in May 2008

"Over 28 million people in India, age 15 and older, accessed the 'net from home and work locations in May — a 27 percent increase from a year ago.
This makes India one of the fastest-growing internet populations, according to comScore's first study of internet usage in India"
Source: MarketingVox, 24th July 2008, citing research by comScore

10m iPhone apps downloaded in the first weekend

"Apple® today announced that iPhone™ and iPod® touch users have already downloaded more than 10 million applications from its groundbreaking new App Store since its launch late last week. Developers have created a wide array of innovative mobile applications ranging from games to location-based social networking to medical applications to enterprise productivity tools. Users can wirelessly download applications directly onto their iPhone or iPod touch* and start using them immediately. More than 800 native applications are now available on the App Store, with more than 200 offered for free and more than 90 percent priced at less than $10."
Source: Apple, 14th July 2008

Apple sold 1m 3G iPhones in the first 3 days of release

"Apple® today announced it sold its one millionth iPhone™ 3G on Sunday, just three days after its launch on Friday, July 11. iPhone 3G is now available in 21 countries—Australia, Austria, Belgium, Canada, Denmark, Finland, Germany, Hong Kong, Ireland, Italy, Japan, Mexico, Netherlands, New Zealand, Norway, Portugal, Spain, Sweden, Switzerland, UK and the US—and will go on sale in France on July 17.
“iPhone 3G had a stunning opening weekend,” said Steve Jobs, Apple’s CEO. “It took 74 days to sell the first one million original iPhones, so the new iPhone 3G is clearly off to a great start around the world.”"
Source: Apple, 14th July 2008

14m new domain names were registered in the first 3 months of 2008

"In the first three months of 2008, the growth of the Internet remained steady as it added 14 million new domain names according to the first quarter 2008 Domain Name Industry Brief
published by VeriSign, Inc., the trusted provider of Internet infrastructure services for the networked world.
The close of the first quarter saw a total base of more than 162 million domain name registrations worldwide across all of the Top Level Domain Names (TLDs). This represents a 26 percent increase over the same quarter last year, and 6 percent growth over the fourth quarter of 2007. That pace of quarterly growth is about the same as the average quarterly growth rate from 2007."
Source: VeriSign, 16th June 2008

More than 8m people downloaded Firefox 3 in the first 24 hours of release

"Thanks to the support of the always amazing Mozilla community, we now hold a Guinness World Record for the most software downloaded in 24 hours. From 18:16 UTC on June 17, 2008 to 18:16 UTC on June 18, 2008, 8,002,530 people downloaded Firefox 3 and are now enjoying a safer, smarter and better Web.
Ever since Firefox was launched in 2004 we've relied on our community to help us spread the word, and thanks to projects including crop circles, newspaper ads, giant stickers, videos, blogs and more we now have over 180 million users in more than 230 countries.
Source: Firefox statement, June 2008

Approximately 80% of mobile phones on sale in the UK are web capable

"Here are the figures: over Ireland and UK operators there is a choice of more than 120 unique different handsets, for a total of nearly 280 choices.
Of this total:
82% are fully mobile web capable and should give a good user experience (like a Nokia 6300, Samsung E840, Sony-Ericsson W580i)
17% are capable but limited by screen size or poor software. (e.g. Sony-Ericsson W375, Nokia 3110)
1% are not capable, and anyway only available in pay-as-you-go and not targeted for web users. (e.g. Motorola W208, Nokia 1200) "
Source: MobiForge.com, June 2008

Japan has about 25% of the global mobile handset market by value

"About 25% of the global cellphone market in terms of cash value is in Japan. - Why? Japanese users want a lot more functions (navigation, mobile payment, QR code, mobile shopping, mobile music and video, mobile TV, ...), and are happy to pay much more per phone. Japan is a totally different game: while NOKIA has about 40% of global market, NOKIA's marketshare in Japan is almost zero."
Source: Eurotechnology Japan, 4th June 2008

Online advertising accounts for more than 10% of all ad spend in 7 European markets

"Online advertising accounted for at least 10 percent of overall advertising spending in Denmark, Germany, the Netherlands, Norway, Poland, Sweden and the UK, the report said.
Norwegian Internet users were the most expensive to target, with advertisers spending 133.20 euros per consumer reached, compared with the European average of 80.60 euros. In the United States, the average was 91.90 euros per person.
The sectors investing most in online advertising were entertainment and leisure, telecoms, and finance and insurance."
Source: Reuters, 2nd June 2008, citing data from the IAB/PWC

Friday, November 28, 2008

63% of rural homes in the UK have broadband, compared to 57% of urban ones

"The regulator's regional communications market report shows that 59% of rural households have broadband compared to 57% of urban homes.
It is the first time that the country has overtaken the town, according to the report.
Four years ago urban dwellers were twice as likely to have broadband as those living in the country. "
Source: BBC, 21st May 2008, citing OFCOM research

UK online advertising revenues hit £2.8bn in 2007

"In 2007, online revenues rose £797m like-for-like, to reach £2.8bn. The rise represented a slowdown from growth of 41% in 2006 and 66% in 2005 but it outstripped the IAB's forecasts of 35%. That prediction was already ahead of most other forecasts, said the trade group."
Source: The Guardian, 8th April 2008, citing PwC/IAB

UK eCommerce spend reached €18.5bn in 2007

"The UK is well ahead of its European counterparts when it comes to online shopping, with sales reaching €18.5bn (£12.8bn) last year, according to Mintel. The company analysed internet retailing across five countries including the UK, Germany and France. Germany was the second biggest online spender with sales reaching €13bn (£12.8bn) last year. Meanwhile France (€7bn, £5.6bn), Italy (€1.1bn, £874m) and Spain (€1bn, £794m) lagged behind the two biggest markets"
Source: Mintel, cited by NMA, 31st March 2008

70% of American girls aged 15-17 maintain a social network profile page

"Girls have embraced social networking sites on a massive scale, with 70% of American girls aged 15-17 having built and regularly worked on a profile page on websites such as MySpace, Bebo and Facebook, as opposed to 57% of boys of the same age.
John Horrigan of the Pew Internet Project says these figures are likely to be echoed throughout the West. “The internet is a very expressive medium and you’re looking at times in a girl’s life when they are very socially expressive; the internet, and social networking particularly, enables that need,” he said."
Source: Pew Internet Project, cited in The Sunday Times, 9th March 2008

Pornographic terms represent 25% of all internet searches

Various statistics on this page including:
"Pornographic websites 4.2 million (12% of total websites)
Pornographic pages 420 million
Daily pornographic search engine requests 68 million (25% of total search engine requests)
Daily pornographic emails 2.5 billion (8% of total emails)
Internet users who view porn 42.7%
Received unwanted exposure to sexual material 34%
Average daily pornographic emails/user 4.5 per Internet user
Monthly Pornographic downloads (Peer-to-peer) 1.5 billion (35% of all downloads)
Source: Various, cited by TopTenReviews, 2006

Filipinos sent 1bn text messages daily in 2008

"Filipinos doubled the number of text messages they sent last year to an average of 1 billion daily, industry data showed on Tuesday.
The Philippines is one of the prolific text messaging centers of the world with even the central bank governor sending monetary policy statements via mobile phone and an increasing number of consumers using their handsets for banking and bill payments."
Source: Reuters, 4th March 2008, citing the Philippine Long Distance Telephone Co. (PLDT)

100bn minutes of calls made on Skype

"And now, Skype has served 100 billion minutes worth of Skype-to-Skype calls. Please, do quote me on that"
Source: Skype's blog, 13th February 2008

Over 85% of the online population has shopped online

"Over 85 percent of the global online population has used the internet to make a purchase, increasing the market for online shopping by 40 percent in the past two years, according to the Nielsen Global Online Survey on internet shopping habits"
Source: Nielsen Online, 30th January 2008

US Video game sales exceeded $17bn in 2007

"Video game sales topped $17 billion last year, according to the NPD Group, making 2007 by far the biggest year in gaming history.
These numbers mark a 43 percent increase year over year, solidifying the games industry's strong lead in growth over movie box office revenue, which totaled $9.7 billion at a 4 percent increase."
Source: Yahoo Games, 22nd January 2008

World of Warcraft has 10m subscribers

"Blizzard Entertainment, Inc. announced today that subscribership for World of Warcraft®, its award-winning massively multiplayer online role-playing game (MMORPG), has continued to climb, recently passing 10 million worldwide. Interest in the game has remained high in all regions, with thousands of new and returning players signing up through the holiday season. World of Warcraft now hosts more than 2 million subscribers in Europe, more than 2.5 million in North America, and approximately 5.5 million in Asia."
Source: Blizzard Entertainment press release, 22nd January 2008

Search marketing makes up 57% of UK online ad spend

"Marketers in the UK say search marketing is the most efficient way to generate leads - so it's no wonder that search marketing accounts for the lion's share of online ad spending compared with other formats, making up more than half (57 percent) of the online advertising dollar (so to speak) in the UK"
Source: MarketingVox, 14th January 2008, citing (ultimately) PwC/IAB research

$29bn spent online in the US from 1st November - 31st December 2007

"“This year’s online holiday shopping season has concluded with a record $29 billion in spending, a 19-percent gain versus year ago,” said comScore Chairman Gian Fulgoni. “Ultimately, the softness in the growth of online retail sales during the first ten days of November proved difficult to overcome and prevented the season’s growth rate from reaching our forecast of 20 percent. However, the period between Thanksgiving and Christmas -- another measure of the strength of the holiday season -- experienced a healthier 21-percent growth rate.”"
Source: comScore press release, 7th January 2008


Wednesday, November 26, 2008

First Post

Years ago I went to see a headhunter to talk about getting a new job.

During the interview I said something like "I very numerate, but also very literate - I'm interested in both sides", to which he said "Yes, that is a problem, isn't it?" (exact quote).

No, it's not a problem, it's a good thing. & so while I have my long running Digital Examples blog to cover adverts, virals and sites, I'm now starting this new Digital Stats blog.

This blog will feature interesting and jaw dropping stats from the digital world. All stats will have a headline figure, a quote to show the figure in context, and a link to the original article.

It's clearly not exhaustive, and while I may be accused of 'lies, damned lies and statistics' it is meant to provide small, memorable facts about how the world is becoming more and more digital.

The aim, as with Digital Examples, is to be able to post in less than 5 minutes, so that I can post often and regularly.

Sunday, November 23, 2008

Multiple Indicator Cluster Survey blog

Screenshot of the "MICS For All" blogThe Multiple Indicator Cluster Surveys (MICS) are household surveys carried out in developing countries with the support of UNICEF to collect data on the situation of children and women. The most recent round of MICS surveys was conducted between 2005 and 2007 in more than 40 countries. MICS data and documentation are available at the Childinfo website of UNICEF.

MICS surveys are among the sources of data analyzed on this site. MICS data were used in articles on trends in primary education in Nepal, children out of school in India, child labor and school attendance in Bolivia, education disparity trends in South Asia, global data on child labor and school attendance, household wealth and years of education, the link between years of schooling and literacy, and other studies.

UNICEF staff members working on the MICS have launched a new blog at globalmics.blogspot.com. The goal of the blog is "to facilitate information sharing between different organizations and individuals involved with MICS implementation around the world" and "to play the role of an unofficial, informal forum to share information on MICS activities." Articles posted since the launch have treated a variety of topics, among them acronyms and abbreviations related to MICS, members of the global MICS team, and the evaluation of the latest round of MICS.

External links
Related articles
Friedrich Huebler, 23 November 2008, Creative Commons License
Permanent URL: http://huebler.blogspot.com/2008/11/mics.html

Sunday, November 16, 2008

Pupil/teacher ratio in secondary school

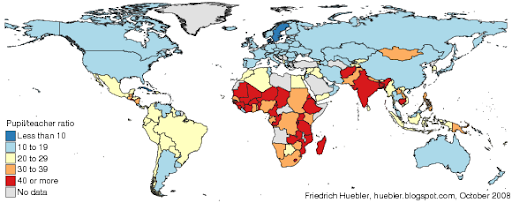
The pupil/teacher ratio is an indicator of education quality. In crowded classrooms with a high number of pupils per teacher the quality of education suffers. For pupils it is difficult to follow the course and teachers can dedicate less time to the needs of each individual student. Data from UNESCO on the pupil/teacher ratio in primary school show that crowded classrooms are more common in Sub-Saharan Africa and Southern Asia than in other parts of the world. 22 of the 27 countries with 40 or more pupils per primary school teacher are located in Sub-Saharan Africa.

In secondary school, pupil/teacher ratios are lower than in primary school. The Data Centre of the UNESCO Institute for Statistics provides the pupil/teacher ratio in secondary school for 189 countries and territories. For 100 countries, the pupil/teacher ratios are from 2006, 9 countries have data from 2007, 51 countries have data from 2004 or 2005, and the remaining 29 countries have data from 1999 to 2003. For the map below, all countries with data were divided into five groups:
  • Fewer than 10 pupils per teacher: 24 countries
  • 10 to 19 pupils per teacher: 107 countries
  • 20 to 29 pupils per teacher: 41 countries
  • 30 to 39 pupils per teacher: 13 countries
  • 40 or more pupils per teacher: 4 countries
Pupil/teacher ratio in secondary school, circa 2006
Map of the world showing national pupil/teacher ratios in secondary school
Data source: UNESCO Institute for Statistics, Data Centre, May 2008.

The lowest pupil/teacher ratios in secondary school were reported for Bermuda (6.0), Tokelau (7.0), Portugal (7.1), and Andorra (7.8). 20 additional countries have pupil/teacher ratios above 8 and below 10: Armenia, Azerbaijan, Belarus, British Virgin Islands, Cayman Islands, Croatia, Georgia, Greece, Kuwait, Lebanon, Liechtenstein, Lithuania, Malta, Monaco, Niue, Norway, Qatar, Russia, Sweden, and Turks and Caicos Islands.

More than half of all countries - including most countries in North and South America, Europe, the Middle East, and East Asia - have pupil/teacher ratios between 10 and 19. The group also includes some countries in other regions. Although pupil/teacher ratios in Sub-Saharan Africa are generally higher than in other parts of the world, the following countries from the region have only 10 to 19 pupils per secondary school teacher: Angola, Botswana, Burundi, Cameroon, Cape Verde, Comoros, Democratic Republic of Congo, Ghana, Guinea-Bissau, Mauritius, Seychelles, and Swaziland. 22 of the 41 countries with pupil/teacher ratios between 20 and 29 are also located in Sub-Saharan Africa.

17 countries have 30 or more pupils per teacher in secondary school and 10 of these countries are in Sub-Saharan Africa. The countries with 30 to 39 pupils per teacher are Chad, Congo, Djibouti, Honduras, India, Kenya, Mozambique, Myanmar, Nepal, Nicaragua, Philippines, South Africa, and Zambia. Classes at the secondary level of education are most crowded in Nigeria (pupil/teacher ratio 40.2), Pakistan (41.9), Malawi (45.6), and Eritrea (54.4).

The following table lists the average pupil/teacher ratio in secondary school by Millennium Development Goal region. The Commonwealth of Independent States (10.9), the developed countries (11.4), Oceania (14.8), Western Asia (15.3), Latin America and the Caribbean (16.6), Eastern Asia (19.0), and Northern Africa (19.0) have average pupil/teacher ratios below 20. Pupil/teacher ratios are highest in South-Eastern Asia (22.8), Sub-Saharan Africa (25.8), and Southern Asia (26.4). The global average is 18.0 pupils per teacher in secondary school. These average values are unweighted, which means that each country is given the same weight within its region, regardless of the size of its population.

Average pupil/teacher ratio in secondary school by MDG region, circa 2006
MDG region
Pupil/teacher ratio
Developed countries 11.4
Commonwealth of Independent States 10.9
Eastern Asia 19.0
South-Eastern Asia 22.8
Oceania 14.8
Southern Asia 26.4
Western Asia 15.3
Northern Africa 19.0
Sub-Saharan Africa 25.8
Latin America and the Caribbean 16.6
World 18.0
Data source: UNESCO Institute for Statistics, Data Centre, May 2008. Regional and global averages are unweighted.

The data analyzed in this article can be downloaded from the UNESCO Institute for Statistics Data Centre, under Predefined Tables - Education - Table 11: Indicators on teaching staff at ISCED levels 0 to 3.

Related articles
External links
Friedrich Huebler, 16 November 2008, Creative Commons License
Permanent URL: http://huebler.blogspot.com/2008/11/ptr.html

Saturday, November 8, 2008

School attendance in Brazil

Brazil is the largest and most populous country in South America. The Brazilian Institute of Geography and Statistics (IBGE) estimates that the population of Brazil grew to 190 million in 2008. The World Bank ranks Brazil as the world's tenth largest economy with a gross domestic product (GDP) of $1.3 trillion in 2007.

Brazil has achieved high levels of school attendance and literacy. The UNESCO Institute for Statistics (UIS) estimates that 94 percent of all children of primary school age were enrolled in primary school in 2005, the latest year with data. The youth literacy rate, for persons aged 15 to 24 years, was 99 percent in 2007 according to the UIS. Among the adult population aged 15 years and older, 91 percent were literate in 2007. In contrast, in 1980 only 75 percent of the adult population of Brazil could read and write.

The patterns of school attendance in Brazil can be studied in greater detail with data from the 2006 National Household Sample Survey (Pesquisa Nacional por Amostra de Domicílios, PNAD). The survey collected data on current and past school attendance for all household members, regardless of age. For the analysis that follows, the levels of education in the PNAD data were recoded to match the International Standard Classification of Education (ISCED) of 1997. Five levels of education are identified:
  • Pre-primary education
  • Primary education
  • Secondary education
  • Tertiary education
  • Adult literacy programs
Adult literacy programs are not part of the ISCED classification but they play an important role in Brazil and are therefore included as a separate group. The graph below illustrates current school attendance by age and level of education for the population aged 0 to 30 years. The number at the top of each bar is the percent of persons of a particular age that are currently in school. For example, 97 percent of all 7-year-olds were in school at the time of the survey; the majority attended primary school but more than 10 percent of all 7-year-olds were still in preschool.

The official school ages in Brazil are indicated along the horizontal axis. The official entrance age for pre-primary education is 4 years, primary education begins at 7 years, and secondary education at 11 years. Education is compulsory for all children aged 7 to 14 years.

Brazil: Current school attendance by age and level of education, 2006
Level of education attended for persons 0 to 30 years, Brazil 2006
Data source: Brazil National Household Sample Survey (PNAD), 2006.

The PNAD data show that many young children in Brazil attend pre-primary education. Two thirds of all children between 4 and 6 years are in preschool or day care. The laws on compulsory education have the desired effect and almost all children between 7 and 14 years are in fact in school. The attendance rates in this age group range from 94 percent among 14-year-olds to 99 percent among 8- to 11-year-olds. Among children of secondary school age, the attendance rate drops steadily from 99 percent at age 11 to 74 percent at age 17. About 8 percent of 18-year-olds are in tertiary education. University attendance rates reach a peak of 15 percent among 20- to 22-year-olds.

Overage school attendance is relatively common in Brazil and many children older than 10 years are still in primary school. Persons up to and beyond age 30 attend secondary education. These high levels of primary and secondary school attendance among the older population are partly a result of a system of education that offers persons who dropped out of school an opportunity to continue their education later in life. Adult literacy programs reach a relatively small part of the population but they contribute to the high level of literacy in Brazil. About 0.5 to 1 percent of the population between 30 and 75 years participate in programs that teach reading and writing.

Data sources
Related articles
External links
Friedrich Huebler, 8 November 2008 (edited 24 January 2009), Creative Commons License
Permanent URL: http://huebler.blogspot.com/2008/11/brazil.html

Saturday, November 1, 2008

Education disparity trends in South Asia

An article on education disparity in South Asia described a newly developed Education Parity Index (EPI). This index combines data on primary school attendance, secondary school attendance and the survival rate to the last grade of primary school, disaggregated by gender, area of residence and household wealth. The value of the EPI has a theoretical range of 0 to 1, where 1 indicates absolute parity.

Through a combination of survey data from several years it is possible to analyze trends in disparity as measured by the EPI. For the trend analysis, data from the following South Asian household surveys - mainly Demographic and Health Surveys (DHS) and Multiple Indicator Cluster Surveys (MICS) - were available.
  • Afghanistan: 2003 MICS
  • Bangladesh: 1999-2000 DHS, 2004 DHS, 2006 DHS
  • India: 1998-99 DHS, 2000 MICS, 2005-06 DHS
  • Nepal: 1996 DHS, 2000 MICS, 2001 DHS, 2006 DHS
  • Pakistan: 2000-01 survey, 2006-07 DHS
The graph below plots the EPI values calculated from each survey. Due to a lack of data, no trends can be shown for Afghanistan.

Education disparity trends in South Asia, 1996-2007
Trend lines with Education Parity Index values between 1996 and 2007
Data source: Demographic and Health Surveys (DHS), Multiple Indicator Cluster Surveys (MICS), 1996-2007.

In Bangladesh, India and Nepal, the EPI has increased from the earliest to the latest year with data, indicating a decrease in disparity over the period of observation. In Bangladesh, the EPI grew from 0.79 in 2000 to 0.84 in 2006. In India, the EPI was at 0.77 in 1999 and 0.82 in 2006. In Nepal, the EPI shows the biggest increase, from 0.67 in 1996 to 0.83 in 2006, interrupted by a decrease from 2000 to 2001. Compared to the other countries, Nepal has thus made the most progress toward parity in the education system.

For Pakistan, the EPI has decreased from 2000 to 2007, indicating an increase in disparity. However, an inspection of the underlying data reveals that the earlier survey did not provide data on household wealth. Disparities related to wealth are usually greater than disparities related to gender or area of residence. If data on wealth had been available, the EPI for 2000 would most likely have been lower. The data from the 2006-07 DHS confirm this assumption. Children from the poorest quintile have much lower attendance and survival rates than children from the richest quintile, and the disparity between these two groups of children is much greater than the disparity between boys and girls and between children from urban and rural households. For example, the primary school net attendance rate (NAR) in Pakistan is 46 percent among children from the poorest household quintile but twice as high, 93 percent, among children from the richest quintile. In comparison, the primary NAR is 76 percent for boys, 67 percent for girls, 82 percent for urban children, and 67 percent for rural children according to the 2006-07 DHS.

The data gaps in the graph bring to attention one limitation of the EPI. The net enrollment rate and other data published annually by UNESCO in the Global Education Digest or the Education For All Global Monitoring Report are not disaggregated beyond gender and can therefore not be used to calculate the EPI. On the other hand, national household survey data, which permit the required level of disaggregation, are not collected every year but only every four or five years, on average.

Related articles
External links
Friedrich Huebler, 1 November 2008 (edited 22 November 2008), Creative Commons License
Permanent URL: http://huebler.blogspot.com/2008/11/south-asia.html

Sunday, October 26, 2008

Pupil/teacher ratio in primary school

Global primary school attendance rates have been on a steady upward trend over the past years. As the world moves closer to the goal of universal primary education, the issue of education quality attracts increasing attention. One measure of education quality is the pupil/teacher ratio, the number of pupils per teacher in a school. Teachers of a large class can dedicate less time to each pupil than in a small class. For the pupils, crowded classrooms make it difficult to concentrate on the material and to learn. The results of overcrowding are lower academic achievement and increased dropout rates.

The map below displays the pupil/teacher ratio in primary school in 194 countries and territories for which data were available. The data were obtained from the UNESCO Institute for Statistics. For 124 countries, the pupil/teacher ratios are from 2006, 12 countries have data from 2007, 42 countries have data from 2004 or 2005, and the remaining 16 countries have data from 1999 to 2003. For the map, all countries were divided into five groups:
  • Fewer than 10 pupils per teacher: 7 countries
  • 10 to 19 pupils per teacher: 90 countries
  • 20 to 29 pupils per teacher: 43 countries
  • 30 to 39 pupils per teacher: 27 countries
  • 40 or more pupils per teacher: 27 countries
Pupil/teacher ratio in primary school, circa 2006
Map of the world showing national pupil/teacher ratios in primary school
Data source: UNESCO Institute for Statistics, Data Centre, May 2008.

The lowest pupil/teacher ratios in primary school were observed in Tokelau (5.8), San Marino (6.3), Bermuda (8.3), Liechtenstein (8.4), Denmark (9.9), and Sweden and Cuba (10.0). Most developed countries, countries in Eastern Europe and former members states of the Soviet Union have pupil/teacher ratios between 10 and 19. Some countries in East and South-East Asia, the Middle East, Africa, and Latin America also belong to this group, among them China, the world's most populous country, with a pupil/teacher ratio of 18.3. The majority of countries in Latin America, as well as some countries in Africa and Asia, have pupil/teacher ratios between 20 and 29.

Pupil/teacher ratios above 30 are common in Sub-Saharan Africa and South Asia. In 11 countries, primary school teachers have more than 50 pupils on average: Afghanistan (83.4), Mozambique (67.4), Rwanda (65.9), Chad (63.2), Mali (55.6), Congo (54.8), Burundi (54.2), Tanzania (53.1), Zambia (51.2), Bangladesh (50.9), and Cambodia (50.4). 22 of the 27 countries with 40 or more pupils per teacher are located in Sub-Saharan Africa.

The following table lists the average pupil/teacher ratio in primary school by Millennium Development Goal region. The highest pupil/teacher ratios exist in Sub-Saharan Africa (40.7) and Southern Asia (37.8). In contrast, the average pupil/teacher ratio in the developed countries is 13.7. In Western Asia (17.8), the Commonwealth of Independent States (17.9), and Oceania (19.8), the average pupil/teacher ratio is also below 20. The global average is 24.6 pupils per teacher in primary school. All regional and global averages are not weighted the population of each country; instead, each country is given the same weight within its region, regardless of the size of its population.

Pupil/teacher ratio in primary school by MDG region, circa 2006
MDG region
Pupil/teacher ratio
Developed countries 13.7
Commonwealth of Independent States 17.9
Eastern Asia 23.4
South-Eastern Asia 26.5
Oceania 19.8
Southern Asia 37.8
Western Asia 17.8
Northern Africa 24.4
Sub-Saharan Africa 40.7
Latin America and the Caribbean 21.3
World 24.6
Data source: UNESCO Institute for Statistics, Data Centre, May 2008. Regional and global averages are unweighted.

The data analyzed in this article can be downloaded from the UNESCO Institute for Statistics Data Centre, under Predefined Tables - Education - Table 11: Indicators on teaching staff at ISCED levels 0 to 3.

Related articles
External links
Friedrich Huebler, 26 October 2008 (edited 16 November 2006), Creative Commons License
Permanent URL: http://huebler.blogspot.com/2008/10/ptr.html

Friday, October 17, 2008

UN Millennium Development Goals Report 2008

Cover of UN MDG Report 2008In August 2008, the United Nations published the latest edition of its annual report on progress toward the Millennium Development Goals (MDG). The Millennium Development Goals Report 2008 presents data for each of the eight MDGs.
  1. Eradicate extreme poverty and hunger
  2. Achieve universal primary education
  3. Promote gender equality and empower women
  4. Reduce child mortality
  5. Improve maternal health
  6. Combat HIV/AIDS, malaria and other diseases
  7. Ensure environmental sustainability
  8. Develop a global partnership for development
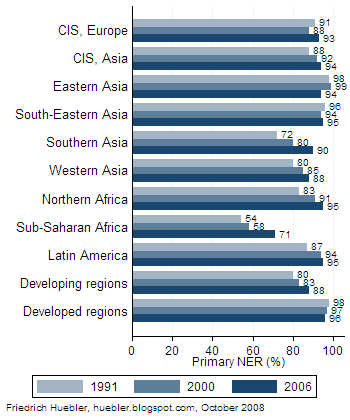
In the section on MDG 2, universal primary education, trends in primary school enrollment from 1991 to 2006 are shown for each MDG region. One region, the Commonwealth of Independent States, is further divided into countries in Europe and Asia. No data are provided for the Oceania region.

Primary school net enrollment rate, 1991-2006
Bar graph with regional primary school net enrollment rates from 1991 to 2006
Source: United Nations, The Millennium Development Goals Report 2008, page 12.

Six MDG regions have reached primary school net enrollment rates at or above 90 percent: Commonwealth of Independent States (Europe and Asia), Eastern Asia, South-Eastern Asia, Southern Asia, Northern Africa, and Latin America. Western Asia is slightly behind with a primary NER of 88 percent. In absolute terms, Sub-Saharan Africa has made the most progress since the turn of the millennium, with a 13 percent increase in the primary NER from 58 percent in 2000 to 71 percent in 2006. This increase was achieved in spite of strong growth in the population of primary school age. Still, three out of ten children of primary school age in Sub-Saharan Africa are not enrolled in primary school. In all developing regions combined, the primary NER rose from 80 percent in 1991 to 88 percent in 2006. In contrast, the primary NER in the developed regions declined from 98 percent in 1991 to 96 percent in 2006.

References
  • United Nations. 2008. The millennium development goals report 2008. New York: United Nations. (Download PDF document, 3.3 MB)
Related articles
External links
Friedrich Huebler, 17 October 2008, Creative Commons License
Permanent URL: http://huebler.blogspot.com/2008/10/mdg-report.html

Sunday, October 12, 2008

Education disparity in South Asia

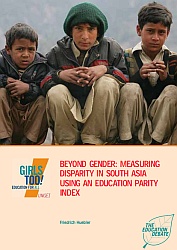
Cover of "Beyond gender: Measuring disparity in South Asia using an education parity index" by Friedrich HueblerA new publication by Friedrich Huebler describes education disparity in the countries of South Asia. The report Beyond gender: Measuring disparity in South Asia using an education parity index was published by the UNICEF regional office for South Asia in its series of papers on girls' education.

Analysis of disparities in national education systems is often limited to gender although other dimensions of disparity are also important. The publication presents data on disparity in primary and secondary education by gender, area of residence and household wealth for countries in South Asia.

To facilitate the interpretation of complex data a newly developed Education Parity Index is introduced. The EPI combines information on disparities across different education indicators and across different groups of disaggregation. This distinguishes the EPI from existing indicators of disparity in education, including the gender parity index and the EFA development index. The EPI is flexible and can be modified according to national priorities, for example by including information on disparities between different ethnic groups.

The use of the EPI as a tool to assess education disparities is illustrated with household survey data from Afghanistan, Bangladesh, India, Nepal and Pakistan. For each country, the report describes how the EPI is calculated. In addition, national trends in education disparity from 1996 to 2006 are presented.

References
  • Huebler, Friedrich. 2008. Beyond gender: Measuring disparity in South Asia using an education parity index. Kathmandu: UNICEF. (Download PDF document, 194 KB)
External links
Related articles
Friedrich Huebler, 12 October 2008 (edited 30 January 2009), Creative Commons License
Permanent URL: http://huebler.blogspot.com/2008/10/epi.html

Sunday, October 5, 2008

Child labor and school attendance

A previous article on child labor on this site presented a definition of child labor that considers both economic activity and household chores. The inclusion of household chores leads to a more precise measure of the burden of work on children. In particular, this new child labor indicator is less biased against girls, who typically spend more time on household chores and less time on economic activity than boys.

In the graph below, the proposed child labor indicator is used to evaluate the trade-off between child labor and school attendance among children aged 7 to 14 years in 35 developing countries. This age group was selected because in all 35 countries children are expected to enter primary school by age 7. The underlying data were collected with 26 Multiple Indicator Cluster Surveys (MICS) and 9 Demographic and Health Surveys (DHS) between 1999 and 2005. 34 of the surveys are nationally representative and one, Palestinians in Syria, is a subnational sample. Surveys conducted during school vacation were excluded from the analysis. The results therefore show the trade-off between child labor and school attendance during a time of the year when children are supposed to be in school.

School attendance refers to attendance of any type of school and not only schools that are part of the formal system of education. In addition, children of secondary school age who are still in primary school are also counted as attending school for the purpose of the present analysis. In contrast, such overage children are counted as out of school when indicators like the secondary school net attendance rate (NAR) are calculated. In a further simplification, child labor is defined for all ages as at least one hour of economic activity or 28 or more hours of household chores per week.

Child labor and school attendance, children 7-14 years
Scatter plot with child labor and school attendance rates in 35 countries
Data source: Demographic and Health Surveys (DHS), Multiple Indicator Cluster Surveys (MICS), 1999-2005.

The scatter plot above demonstrates the trade-off between child labor and school attendance. Countries with low child labor rates typically have high school attendance rates and vice versa. A linear regression shows that a 10 point increase in child labor is associated with a 7.6 point decrease in school attendance at the national level.

On average across the 35 countries in the sample, 77 percent of 7- to 14-year-olds attended school at the time of they survey. In ten countries, at least 90 percent of children were in school. In seven countries - Central African Republic, Chad, Guinea-Bissau, Mali, Niger, Sierra Leone, and Somalia - less than half of all children went to school. Somalia has by far the lowest attendance rate with 19 percent.

25 percent of all children between 7 and 14 years were engaged in child labor, ranging from 4 percent among Palestinians in Syria to 78 percent in Niger and Sierra Leone. In six countries, more than half of all children in this age group were child laborers: Central African Republic, Chad, Guinea-Bissau, Niger, Sierra Leone, and Uganda.

Related articlesExternal links
Friedrich Huebler, 5 October 2008, Creative Commons License
Permanent URL: http://huebler.blogspot.com/2008/10/child-labor.html

Sunday, September 7, 2008

Child labor: economic activity and household chores

Child labor is one of the obstacles on the way to the Millennium Development Goal of universal primary education by 2015. In a report on global child labor trends, the International Labour Organization (ILO) estimates that there are 218 million child laborers worldwide. 126 million of these children are estimated to be engaged in hazardous work (ILO 2006). The concept of child labor used by the ILO is derived from two conventions: ILO Convention 138, which sets 15 years as the general minimum age for employment, and ILO Convention 182 on the worst forms of child labor. Any work in violation of Conventions 138 and 182 is considered illegal child labor that should be eliminated.

One limitation of statistics like those published by the ILO is that they only refer to economic activity, that is work related to the production of goods and services, as defined in the United Nations System of National Accounts (UNSD 2001). This definition excludes chores undertaken in a person's own household like cooking, cleaning or caring for children.

Statistics of child labor that ignore household chores are problematic because they underestimate the burden of work on children, especially for girls. To examine the relative burden of economic activities and household chores carried out by children, data from 35 household surveys were analyzed for this article. Grouped by Millennium Development Region, these surveys are:
  • Developed countries: Albania.
  • Eastern Asia: Mongolia.
  • South-eastern Asia: Lao PDR, Philippines.
  • Southern Asia: India.
  • Western Asia: Bahrain, Lebanon, Palestinians in Syria.
  • Sub-Saharan Africa: Angola, Burundi, Central African Republic, Chad, Comoros, Congo, Côte d'Ivoire, Democratic Republic of the Congo, Gambia, Guinea, Guinea-Bissau, Kenya, Lesotho, Malawi, Mali, Niger, Senegal, Sierra Leone, Somalia, Swaziland, Tanzania, Uganda.
  • Latin America and the Caribbean: Bolivia, Colombia, Dominican Republic, Nicaragua, Trinidad and Tobago.
The surveys were conducted between 1999 and 2005. 26 of the surveys were Multiple Indicator Cluster Surveys (MICS) and 9 were Demographic and Health Surveys (DHS). All 35 surveys collected data on work by children in the week preceding the survey. Surveys conducted during school vacation were excluded because the focus of the present analysis is work by children that should have been in school at the time of the survey.

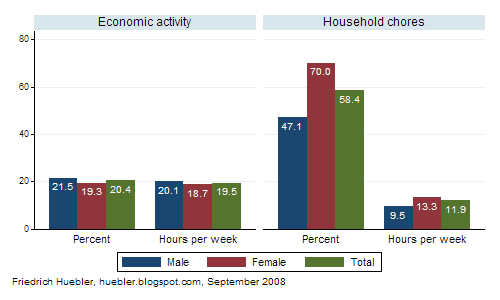
The share of children aged 7 to 14 years in economic activity and household chores is depicted in the following graph. The graph also displays the number of hours spent per week on both types of work. All numbers are averages across the 35 surveys, weighted by each country's population between 7 and 14 years.

Economic activity and household chores, children 7-14 years
Graph showing the link between household wealth and average years of education
Data source: 35 DHS and MICS surveys, 1999-2005.

The results confirm that boys are more likely to be engaged in economic activity while girls are more likely to do household chores. On average across the 35 surveys, 22 percent of all boys and 19 percent of all girls between 7 and 14 years are engaged in economic activity. Boys also spend more hours on economic activity than girls, 20 compared to 19 hours. By comparison, girls are much more likely than boys to do household chores. 70 percent of all girls and 47 percent of all boys did household chores in the week preceding the survey. On average, girls spent 13 hours and boys 10 hours per week on household chores.

What are the implications of these findings for statistics of child labor, as currently defined by the ILO? Take the case of two families that need additional income to provide food for everyone in the household. In the first family, a 10-year-old boy is withdrawn from school and put to work on a farm. Because such work is considered economic activity the number of child laborers goes up. In the second family, the mother decides to start working on a farm and her 10-year-old daughter is asked to stay at home to care for her younger siblings. Because the girl is engaged in household chores the number of child laborers does not change. The consequences are the same for both children: they no longer go to school and miss out on the benefits from education.

To address the limitations of the ILO's definition of child labor, UNICEF has developed an expanded definition that covers household chores in addition to economic activity. This revised indicator is the basis for the child labor estimates that are reported in publications like Progress for Children (UNICEF 2007a) or The State of the World’s Children (UNICEF 2007b). For children 5 to 17 years of age, UNICEF defines child labor as follows:
  • 5 to 11 years: any economic activity, or 28 hours or more household chores per week;
  • 12 to 14 years: any economic activity (except light work for less than 14 hours per week), or 28 hours or more household chores per week;
  • 15 to 17 years: any hazardous work, including any work for 43 hours or more per week.
The goal of UNICEF's child labor indicator is the measurement of work that should be eliminated because it violates international child labor conventions and interferes with school attendance. The threshold for household chores is set relatively high because it is assumed that household chores are less harmful than economic activity. Moreover, the high threshold of 28 hours household chores per week avoids a possible overestimation of the number of child laborers.

References
  • International Labour Organization (ILO). 2006. Global child labour trends 2000-2004. Geneva: ILO. (Download PDF, 640 KB)
  • United Nations Children's Fund (UNICEF). 2007a. Progress for children: A World Fit for Children statistical review. New York: UNICEF. (Download PDF, 3.6 MB)
  • United Nations Children's Fund (UNICEF). 2007b. The state of the world's children 2008: Child survival. New York: UNICEF. (Download PDF, 4.3 MB)
  • United Nations Statistics Division (UNSD). 2001. System of national accounts 1993. http://unstats.un.org/unsd/sna1993/toctop.asp.
Related articles
External links
Friedrich Huebler, 7 September 2008 (edited 5 October 2008), Creative Commons License
Permanent URL: http://huebler.blogspot.com/2008/09/child-labor.html